Description of the Monitoring Tab
The monitoring tab contains information about the flow of real time data between PcVue managers.
Using the drop down list box at the top left hand corner of the dialog you can choose to display information about either data being acquired by PcVue, or data being produced by PcVue.
- Data acquisition - Data being acquired. For example, the contents of a read frame of one of the native drivers.
- Data command - Data being produced and sent. For example, the contents of a write frame of one of the native drivers.
Using the drop down list box at the center top of the dialog, you can choose the source of the data from one of the following.
- All
- Internal
- External
- Equipment
- DDE
- OPC (client)
- LonWorks
- BACnet
- IEC 61850
- IEC 60870-5
- DNP3
- SNMP
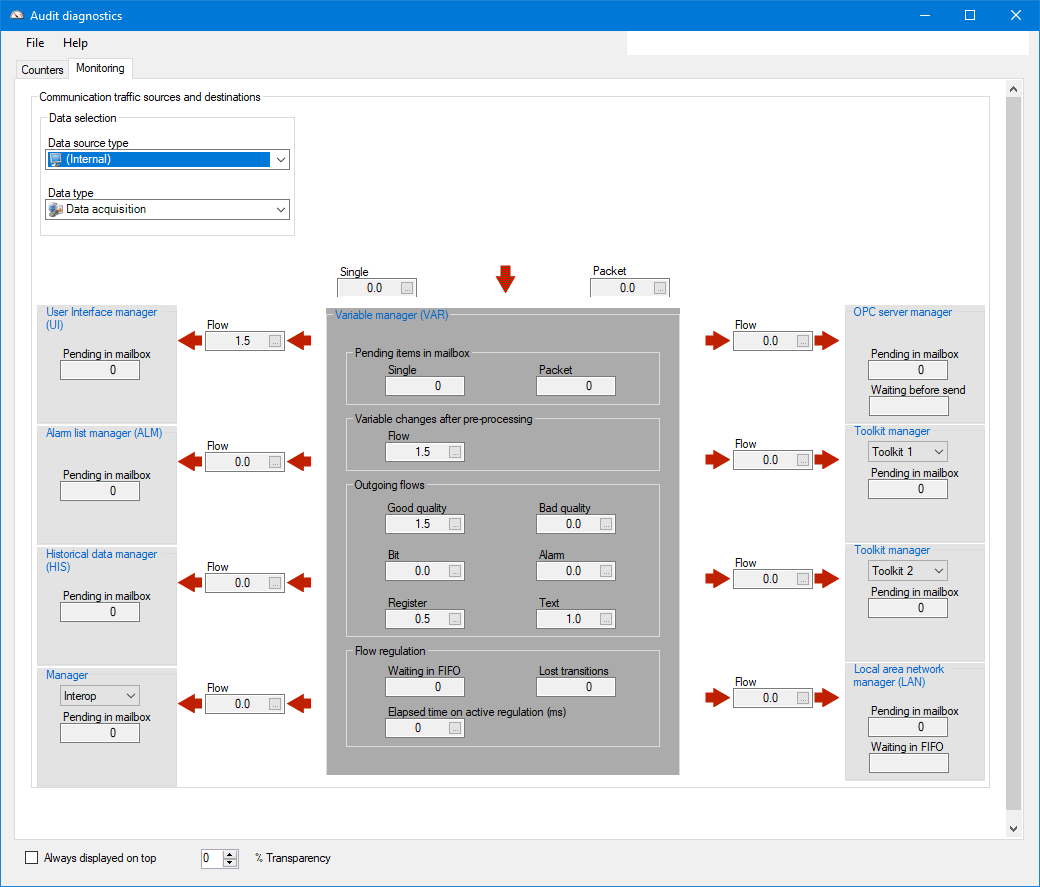
If you choose ALL then the information about the flow of data from all sources is combined. In the following picture, the monitoring tab is displaying Data Acquisition from the Internal source.
Menu commands are provided to reset the flow counters, reset the time counters and to close the dialog. ![]() Show picture
Show picture
Useful notes and terminology
Two types of information are displayed in the monitoring tab.
- Flow rates - A rolling 10 second average of the data rate (changes per second). The fields that display flow rates have an Ellipsis button adjacent to them. Clicking on the Ellipsis button displays a pop-up containing the real-time value and the last 5 highest values along with their timestamps.
- Counters - A numeric value counting the number of occurrences of an item. Counters do not include an Ellipsis button.
Managers exchange real-time data in two message formats.
- Single - A single data point such as an OPC Item or single variable.
- Packet - Several data points treated together. For example, a communication frame, OPC group or recipe.
The dialog shows all managers. Some of the managers have additional functions.
- User interface manager - Responsible for the Graphical User Interface and also SCADA Basic, VBA, expressions, recipes and Web Services including WebVue.
- OPC server manager - Responsible for PcVue as an OPC server and also the HDS.
Data acquisition flow regulation behaves differently depending on the source.
- For equipment (native drivers) when flow regulation takes place communication is temporarily suspended and no request for data frames is made.
- For all other sources when flow regulation takes place communication continues but the application only keeps the most recent values. The number of lost values is counted in the Lost Transitions counter.
Why is the Flow Regulation group sometimes colored red?
- The background of the Flow Regulation group, at the bottom of the dialog, is colored red whenever flow regulation is active. This corresponds to a value of 1 for the bit variable System.Audit.<Source>.State.VariableDataChange.ActiveFlowRegulation.
PcVue only exchanges real-time data between managers when it changes. It does not cyclically send data.