Configuring the Trend Viewer's Advanced Features
The Trend Viewers advanced features are all found in the Advanced tab. ![]() Show picture
Show picture

- Use the filtering period with interpolated mode - See below.
- Filter real time buffer using trend filtering period - See below.
- Keep real time variable subscription in historical mode - Maintain subscription of the real-time value of variables plotted on the chart when the Trend Viewer is switched to historic mode. This is useful for the Legend if you are displaying the real-time value.
- Allow historical requests in the future - Allows the Trend Viewer to make requests for historic data that are in the future. Used when importing predicted values from a third party application.
- At the opening of the mimic in real time mode
- Process historical request - When a Trend Viewer is opened in real-time mode a request is made for historical data for the period of the chart so that the chart is populated with previous values.
- Use compression - Where there are more data points than horizontal pixels, discard the surplus data points rather than plotting several points on the same vertical axis.
- Default run time calendar type - Select the default calendar that is displayed when making a historical request at run time. Either Start Date to End Date or Start Date and Period.
- Allow switching mode at run time - Allow the user to switch between calendar modes at run time.
Using the Use the Filtering Period with Interpolated Mode property
When you select the Interpolated mode  for
plotting a trace the value of the variable at any point on the trace is
calculated by interpolating the values between successive points. This
gives a smoother appearance to the plot but can be misleading particularly
when values are changing very infrequently.
for
plotting a trace the value of the variable at any point on the trace is
calculated by interpolating the values between successive points. This
gives a smoother appearance to the plot but can be misleading particularly
when values are changing very infrequently.
This can be improved by selecting the Use the Filtering Period with Interpolated Mode property in the Advanced tab. When this property is selected and the time between two points is greater than the Filter period the trace will be horizontal until the time of the second point minus the Filter period. The following screen shot illustrates this.
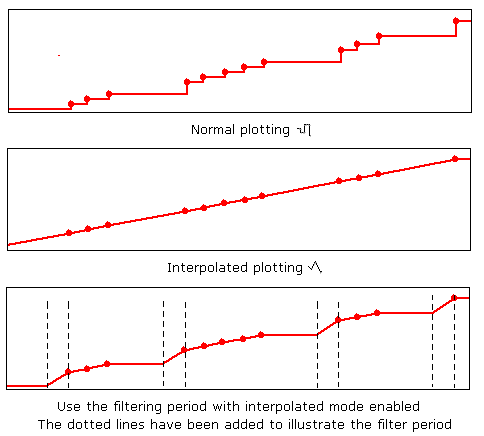
For a true view of the actual values recorded in the Archive
Unit you should use the default  plot style.
Using the Filter Real Time Buffer Using Trend Filtering Period property
This is best explained by an example. Consider a register variable changing at random intervals of between 1 and 10 seconds. It is configured for trend recording with a filter period set to 10 seconds.
In the following picture, a mimic was opened at approximately 10:26. It contains two trend viewers with identical configuration except the top trend viewer has the property Filter Real Time Buffer Using Trend Filtering Period not set, and in the bottom trend viewer it is set. Both trend viewers are configured to run in real time mode. ![]() Show picture
Show picture
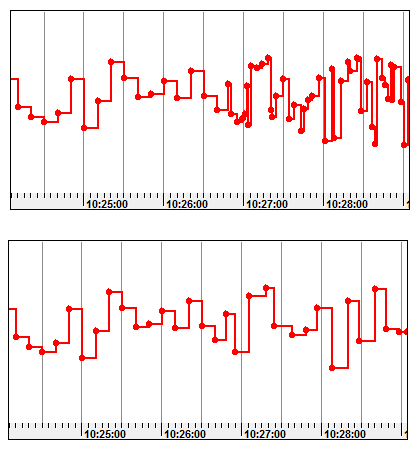
In the top trend viewer, you can see that before to 10:26 the data has been read from the archive file and therefor is plotted every 10 seconds (the period of the trend filter). After 10:26 it is plotted whenever the variable changes - randomly between 1 and 10 seconds.
In the bottom trend viewer the data before to 10:26 is also read from the archive file and is therefore the same as in the top trend viewer. However, after 10:26 the data is plotted in real time but using a filter period of 10 seconds (as configured for the variable's trend recording).
This option produces a plot for real-time data that has the same appearance as the equivalent plot for historic data from the archive file. In particular, for processes where the real-time value is changing rapidly, this helps to avoid bad interpretation between real-time and historical plots.