CHART
Manage the operation of an XY Chart in the HMI.
WebVue support - No. Returns an unsuccessful code if used in this context.
| Mode | Mnemonic | Syntax |
| 1 | AXE_SETRANGE | 1 |
| 2 | AXE_SETTITLE | 2 |
| 3 | LINE_CLEAR | 3 |
| 4 | LINE_START | 4 |
| 5 | LINE_END | 4 |
| 6 | 5 | |
| 7 | RANGE_ADDPOINT | 6 |
| 8 | RANGE_CLEAR | 7 |
| 9 | RANGE_REMOVEPOINT | 8 |
| 10 | REFRESH | 9 |
| 11 | SERIES_ADDPOINT | 10 |
| 12 | SERIES_CLEAR | 11 |
| 13 | SERIES_GETCOUNT | 11 |
| 14 | SERIES_GETTS | 12 |
| 15 | SERIES_GETXVALUE | 12 |
| 16 | SERIES_GETYVALUE | 12 |
| 17 | SERIES_IDXFROMX | 28 |
| 18 | SERIES_IDXFROMXY | 14 |
| 19 | SERIES_REMOVEPOINT | 27 |
| 20 | SERIES_SETVAR | 15 |
| 21 | SERIES_SHOW | 16 |
| 22 | SERIES_SORT | 11 |
| 23 | SERIES_STATS | 17 |
| 24 | SERIES_YCOUNTFROMX | 18 |
| 25 | SERIES_YVALUEFROMX | 13 |
| 26 | SETDATETIME | 19 |
| 27 | SETENDTIMEPERIOD | 20 |
| 28 | SETSTARTTIMEPERIOD | 21 |
| 29 | SETSAMPLEPERIOD | 22 |
| 30 | SETSOURCEVAR | 23 |
| 31 | SETTITLE | 24 |
| 32 | SERIES_TOFRONT | 11 |
| 33 | COPY_CLIPBOARD | 9 |
| 34 | SAVE_IMAGE | 25 |
| 35 | SHOW_LEGEND | 26 |
Properties Common to all Modes
|
Argument |
Meaning |
| Window | The name of the window containing the chart. Type STR. |
| Branch | The branch of the window containing the chart. Type STR. |
| Identifier | The Identifiant of the chart (within the window). Type STR |
Syntax 1
LongVal = CHART (Mode, Window, Branch, Identifier, Axis, Min, Max);
Return type: LONG.
|
Argument |
Meaning |
| Axis |
A number representing the axis that is to be modified. Type LONG. 1 = X 2 = Y (Left) 3 = Y (Right) |
| Min | The new value for the axis minimum. Type DOUBLE. |
| Max | The new value for the axis maximum. Type DOUBLE. |
Execution
|
Mode |
Mnemonic |
Action |
| 1 | AXE_SETRANGE |
Set the axis range. If 0 is used for both max and min, the range is set to automatic. |
Syntax 2
LongVal = CHART (Mode, Window, Branch, Identifier, Axis, Title);
Return type: LONG.
|
Argument |
Meaning |
| Axis |
A number representing the axis that is to be modified. Type LONG. 1 = X 2 = Y (Left) 3 = Y (Right) |
| Title | The new axis title. Type STR. |
Execution
|
Mode |
Mnemonic |
Action |
| 2 | AXE_SETTITLE |
Set the axis title. Return: 1 if OK, else 0. |
Syntax 3
LongVal = CHART (Mode, Window, Branch, Identifier, LineID);
Return type: LONG.
|
Argument |
Meaning |
| LineID |
The ID of the Line object. Either 1 or 2. Type LONG. |
Execution
|
Mode |
Mnemonic |
Action |
| 3 | LINE_CLEAR |
Clear the line object. Return: 1 if OK, else 0. |
Syntax 4
LongVal = CHART (Mode, Window, Branch, Identifier, LineID, X, Y);
Return type: LONG.
|
Argument |
Meaning |
| LineID |
The ID of the Line object. Either 1 or 2. Type LONG. |
| X, Y |
The new X and Y co-ordinates. Type DOUBLE. |
Execution
|
Mode |
Mnemonic |
Action |
| 4 | LINE_END |
Set new co-ordinates for the end point of the line. |
| 5 | LINE_START | Set new co-ordinates for the start point of the line. |
| Return: 1 if OK, else 0. |
Syntax 5
LongVal = CHART (Mode, Window, Branch, Identifier [, Orientation [, Printer]]);
Return type: LONG.
|
Argument |
Meaning |
| Orientation |
The orientation of the printed output. Optional. Type LONG. 1 = Landscape 2 = Portrait |
| X, Y |
The name of the printer to be used for output. Type STR. |
Execution
|
Mode |
Mnemonic |
Action |
| 6 |
Print the Chart on the selected printer. Return: 1 if OK, else 0. |
Syntax 6
LongVal = CHART (Mode, Window, Branch, Identifier, RangeID, X, YLow, YHigh);
Return type: LONG.
|
Argument |
Meaning |
| RangeID |
The ID of the Range object Either 1 or 2. Type LONG. |
| X |
The X value of the point. Type DOUBLE. |
| YLow | The Y low value of the point. Type DOUBLE. |
| YHigh | The Y high value of the point. Type DOUBLE. |
Execution
|
Mode |
Mnemonic |
Action |
| 7 | RANGE_ADDPOINT |
Add a point to the range object. Return: 1 if OK, else 0. |
Syntax 7
LongVal = CHART (Mode, Window, Branch, Identifier, RangeID);
Return type: LONG.
|
Argument |
Meaning |
| RangeID |
The ID of the Range object Either 1 or 2. Type LONG. |
Execution
|
Mode |
Mnemonic |
Action |
| 8 | RANGE_CLEAR |
Clear the range object. Return: 1 if OK, else 0. |
Syntax 8
LongVal = CHART (Mode, Window, Branch, Identifier, RangeID, Index);
Return type: LONG.
|
Argument |
Meaning |
| RangeID |
The ID of the Range object Either 1 or 2. Type LONG. |
| Index | A zero based index of the point to be removed. Type DOUBLE. |
Execution
|
Mode |
Mnemonic |
Action |
| 9 | RANGE_REMOVEPOINT |
Remove a point from the range object. Return: 1 if OK, else 0. |
Syntax 9
LongVal = CHART (Mode, Window, Branch, Identifier);
Return type: LONG.
Execution
|
Mode |
Mnemonic |
Action |
| 10 | REFRESH |
Refresh the chart re-processing the historical request. |
| 33 | COPY_CLIPBOARD |
Copy an image representing the chart to the clipboard so that it can be used in other applications (Word etc.). |
| Return: 1 if OK, else 0. |
Syntax 10
LongVal = CHART (Mode, Window, Branch, Identifier, SeriesID, X, Y [, TS]);
Return type: LONG.
|
Argument |
Meaning |
| SeriesID |
The ID of the series. Range 1 to 8. Type LONG. |
| X | X value of the point. Type DOUBLE. |
| Y | Y value of the point. Type DOUBLE. |
| TS | Timestamp of the point. Optional. Type DOUBLE. |
Execution
|
Mode |
Mnemonic |
Action |
| 11 | SERIES_ADDPOINT |
Add a data point to the series. Return: 1 if OK, else 0. |
Syntax 11
LongVal = CHART (Mode, Window, Branch, Identifier, SeriesID);
Return type: LONG.
|
Argument |
Meaning |
| SeriesID |
The ID of the series. Range 1 to 8. Type LONG. |
Execution
|
Mode |
Mnemonic |
Action |
| 12 | SERIES_CLEAR |
Clear the series. Return: 1 if OK, else 0. |
| 13 | SERIES_GETCOUNT |
Return the number of points in the series. Return: The number of points in the series if no error, otherwise -1. Return 0 if executed in WebVue context. |
| 22 | SERIES_SORT |
Sort the series against the X-axis. Return: 1 if OK, else 0. |
| 32 | SERIES_TOFRONT |
Move the series to the front of the chart. Return: 1 if OK, else 0. |
Syntax 12
DblVal = CHART (Mode, Window, Branch, Identifier, SeriesID, Index);
Return type: DOUBLE.
|
Argument |
Meaning |
| SeriesID |
The ID of the series. Range 1 to 8. Type LONG. |
| Index | A zero based index of the point. Type DOUBLE. |
Execution
|
Mode |
Mnemonic |
Action |
| 14 | SERIES_GETTS |
Get the timestamp of the point. Return: The timestamp value if OK, -1 if index is out of range, 0 for any other errors. |
| 15 | SERIES_GETXVALUE |
Get the X value of the point. Return: The X value if OK, -1 if index is out of range, 0 for any other errors. |
| 16 | SERIES_GETYVALUE |
Get the Y value of the point. Return: The Y value if OK, -1 if index is out of range, 0 for any other errors. |
Syntax 13
DblVal = CHART (Mode, Window, Branch, Identifier, SeriesID, X [, Rank]);
Return type: DOUBLE.
|
Argument |
Meaning |
| SeriesID |
The ID of the series. Range 1 to 8. Type LONG. |
| X | Given X value. Type DOUBLE. |
| Rank | The rank of the data point having the X value. Optional. Type DOUBLE. |
Execution
|
Mode |
Mnemonic |
Action |
| 25 | SERIES_YVALUEFROMX | Return: The Y value if the point exists, -1 if the point does not exist, 0 for all other errors. |
Syntax 14
LongVal = CHART (Mode, Window, Branch, Identifier, SeriesID, X, Y [, IndexStart [,IndexEnd]]);
Return type: LONG.
|
Argument |
Meaning |
| SeriesID |
The ID of the series. Range 1 to 8. Type LONG. |
| X | Given X value. Type DOUBLE. |
| Y | Given Y value. Type DOUBLE. |
| IndexStart | The index from where to start the search. Type DOUBLE. |
| IndexEnd | The index at which to end the search. Type DOUBLE. |
Execution
|
Mode |
Mnemonic |
Action |
| 18 | SERIES_IDXFROMXY |
Return: The index of the point if it exists, -1 if the point does not exist, 0 for all others errors. |
Syntax 15
LongVal = CHART (Mode, Window, Branch, Identifier, SeriesID, VarName);
Return type: LONG.
|
Argument |
Meaning |
| SeriesID |
The ID of the series. Range 1 to 8. Type LONG. |
| VarName | The name of a Variables Tree variable. Type STR. |
Execution
|
Mode |
Mnemonic |
Action |
| 20 | SERIES_SETVAR |
Change the variable used for the series source. Return: 1 if OK, else 0. |
Syntax 16
LongVal = CHART (Mode, Window, Branch, Identifier, SeriesID, Show);
Return type: LONG.
|
Argument |
Meaning |
| SeriesID |
The ID of the series. Range 1 to 8. Type LONG. |
| Show |
Flag to select show or hide. 1 = Show 0 = Hide |
Execution
|
Mode |
Mnemonic |
Action |
| 21 | SERIES_SHOW |
Show or hide the series. Return: 1 if OK, else 0. |
Syntax 17
DblVal = CHART (Mode, Window, Branch, Identifier, SeriesID, Stats);
Return type: DOUBLE.
|
Argument |
Meaning |
| SeriesID |
The ID of the series. Range 1 to 8. Type LONG. |
| Show |
Flag to select which statistic to return. 1 = X minimum 2 = X maximum 3 = Y minimum 4 = Y maximum 5 = Average 6 = Median |
Execution
|
Mode |
Mnemonic |
Action |
| 23 | SERIES_STATS |
Calculate statistical data. Return: The requested statistic value or 0 if unsuccessful. |
Syntax 18
LongVal = CHART (Mode, Window, Branch, Identifier, SeriesID, X);
Return type: LONG.
|
Argument |
Meaning |
| SeriesID |
The ID of the series. Range 1 to 8. Type LONG. |
| X |
Given X value |
Execution
|
Mode |
Mnemonic |
Action |
| 25 | SERIES_YCOUNTFROMX |
Return: The number of points having the given X value if no error, else 0. |
Syntax 19
LongVal = CHART (Mode, Window, Branch, Identifier, StartTime [, EndTime]);
Return type: LONG.
|
Argument |
Meaning |
| StartTime |
Start time. Type DOUBLE. |
| EndTime |
End time. Optional. Type DOUBLE. |
Execution
|
Mode |
Mnemonic |
Action |
| 26 | SETDATETIME |
Initiate a historical request from the start date to the end date. If the end time is omitted the current time is used. Return: 1 if OK, -1 if the resulting number of points is greater than maximum allowed, -2 for invalid time range, 0 for all other errors. |
Syntax 20
LongVal = CHART (Mode, Window, Branch, Identifier, EndTime, Period [, TimeUnit]);
Return type: LONG.
|
Argument |
Meaning |
| EndTime |
End time. Type DOUBLE. |
| Period |
Duration. Type DOUBLE. |
| TimeUnit |
The time unit for the period. 0 = Milliseconds 1 = Seconds 2 = Minutes 3 = Hours 4 = Days |
Execution
|
Mode |
Mnemonic |
Action |
| 27 | SETENDTIMEPERIOD |
Initiate a historical request with the Start time set to EndTime minus the Period and the End time set to EndTime. Return: 1 if OK, -1 if the resulting number of points is greater than maximum allowed, -2 for invalid time range, 0 for all other errors. |
Syntax 21
LongVal = CHART (Mode, Window, Branch, Identifier, StartTime, Period [, TimeUnit]);
Return type: LONG.
|
Argument |
Meaning |
| StartTime |
Start time. Type DOUBLE. |
| Period |
Duration. Type DOUBLE. |
| TimeUnit |
The time unit for the period. 0 = Milliseconds 1 = Seconds 2 = Minutes 3 = Hours 4 = Days |
Execution
|
Mode |
Mnemonic |
Action |
| 28 | SETSTARTTIMEPERIOD |
Initiate a historical request with the Start time set to StartTime and the End time set to the StartTime plus the Period. Return: 1 if OK, -1 if the resulting number of points is greater than maximum allowed, -2 for invalid time range, 0 for all other errors. |
Syntax 22
LongVal = CHART (Mode, Window, Branch, Identifier, SamplePeriod [, TimeUnit]);
Return type: LONG.
|
Argument |
Meaning |
| SamplePeriod |
Sample period. Type DOUBLE. |
| TimeUnit |
The time unit for the period. 0 = Milliseconds 1 = Seconds 2 = Minutes 3 = Hours 4 = Days |
Execution
|
Mode |
Mnemonic |
Action |
| 29 | SETSAMPLEPERIOD |
Set the sample period that is to be used for subsequent historical requests. Return: 1 if OK, -2 for invalid time range, 0 for all other errors. |
Syntax 23
LongVal = CHART (Mode, Window, Branch, Identifier, VarName);
Return type: LONG.
|
Argument |
Meaning |
| VarName |
The name of a trended variable. Type STR. |
Execution
|
Mode |
Mnemonic |
Action |
| 30 | SETSOURCEVAR |
Change the variable used for the X axis. Return: 1 if OK, else 0. |
Syntax 24
LongVal = CHART (Mode, Window, Branch, Identifier, Title);
Return type: LONG.
|
Argument |
Meaning |
| Title |
The title for the chart. Type STR. |
Execution
|
Mode |
Mnemonic |
Action |
| 31 | SETTITLE |
Change the title displayed in the chart. Return: 1 if OK, else 0. |
Syntax 25
LongVal = CHART (Mode, Window, Branch, Identifier, Path, ImageFormat);
Return type: LONG.
|
Argument |
Meaning |
| Path |
Either the absolute path for the image. For example, E:\\ChartImages\\hangar18.png. Or just the image name in which case the image will be saved in the project's TP folder. Type STR. |
| ImageFormat |
The image format. 0 = BMP 1 = GIF 2 = PNG |
Execution
|
Mode |
Mnemonic |
Action |
| 34 | SAVE_IMAGE |
Save an image of the chart to the specified location in the specified format. Return: 1 if OK, else 0. |
Syntax 26
LongVal = Chart (Mode, Window, Branch, Identity[, Show])
Return type: LONG.
|
Argument |
Meaning |
| Show |
A flag. Type INTEGER. |
Execution
|
Mode |
Mnemonic |
Action |
| 35 | SHOW_LEGEND |
Show or hide the chart legend. Return: 1 if OK, else 0. |
Syntax 27
LongVal = CHART (Mode, Window, Branch, Identifier, SeriesID, Index);
Return type: LONG.
|
Argument |
Meaning |
| SeriesID |
The ID of the series. Range 1 to 8. Type LONG. |
| Index | A zero based index of the point. Type DOUBLE. |
Execution
|
Mode |
Mnemonic |
Action |
| 19 | SERIES_REMOVEPOINT |
Remove a data point from a series. Return: 1 if OK, -1 if index is out of range, 0 for any other errors. |
Syntax 28
LongVal = CHART (Mode, Window, Branch, Identifier, SeriesID, X [, Rank]);
Return type: LONG.
|
Argument |
Meaning |
| SeriesID |
The ID of the series. Range 1 to 8. Type LONG. |
| X | Given X value. Type DOUBLE. |
| Rank | The rank of the data point having the X value. Optional. Type DOUBLE. |
Execution
|
Mode |
Mnemonic |
Action |
| 17 | SERIES_IDXFROMX |
Return: The index of the point if it exists,
-1 if the point does not exist, 0 for all others errors. |
Further Information
Consider the series S0 which is comprised of the following points: P1(10,15), P2(11,20), P3(15,20), P4(18,25), P5(18,25), P6(21,100) ,P7(21,105).
SERIES_IDXFROMXY
SERIES_IDXFROMXY returns the index of the first point in the series with the given X and Y. So the code:
CHART ("SERIES_IDXFROMXY", cWindow, cBranch, cIdentifier, cSeriesID, 18, 25);would return 4 representing P4(18,25). You can also specify an optional start point and end point for the search.
SERIES_IDXFROMX
SERIES_IDXFROMX is similar to SERIES_IDXFROMXY except that you only specify X. So for the series S0, if X = 15, it will return 3 representing P3(15,20). You can also specify an optional rank. For example,, if you were looking for the second point with X = 21 you would specify a rank of 1 (rank of 0 is the first point). The return would be 7 representing P7(21,105).
SETENDTIMEPERIOD
The following code fragment will generate the equivalent of this historical request.
![]() Show picture
Show picture
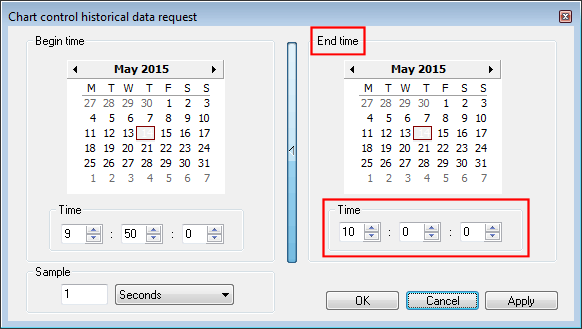
Dim dTime As Double;
Dim lReturn As Long;
dTime = DateTimeValue("14/05/2015", "10:00:00");
lReturn = Chart("SETENDTIMEPERIOD", "MyChartMimic", "", "Chart1", dTime, 10, 2);
SETSTARTTIMEPERIOD
The following code fragment will generate the equivalent of this historical request.
![]() Show picture
Show picture
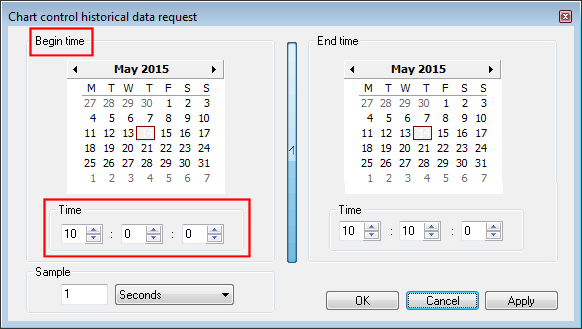
Dim dTime As Double;
Dim lReturn As Long;
dTime = DateTimeValue("14/05/2015", "10:00:00");
lReturn = Chart("SETSTARTTIMEPERIOD", "MyChartMimic", "", "Chart1", dTime, 10, 2);