


Overview
The workflow consists of two actions available from a WebVue mimic:
- Generate – triggers the Data Export engine to produce an Excel file.
- Open – opens the generated file directly in the WebVue browser tab.
A status variable (GENERAL.EXPORTS.DIAGNOSTIC.STATUS) reflects the current state of the export in real time, using enumerated labels to display a human-readable status (e.g., Idle, In progress, Done, Error).
Prerequisites
- Microsoft Excel installed on the local machine.
- PcVue Web Server and PcVue Backend with Data Export on the same station.
Step 1 – Configure the Data Export
In PcVue Application Explorer > Data Analysis > Data Exports, create a new export named DIAGNOSTIC and configure it as follows:
| Setting | Value |
|---|---|
| Export name | DIAGNOSTIC |
| Output type | Excel (.xlsx) |
| Template file | Diagnostic.xlsx (in DataExportTemplates\) |
| Output file name | Diagnostic |
| Output folder | DataExports\ (relative to the project root) |
| Behaviour if file exists | Overwrite |
| Status variable | GENERAL.EXPORTS.DIAGNOSTIC.STATUS |
The output file will be written to the DataExports\ folder at the root of the project, for example:
C:\PcVue Projects\WebVueDataExport\DataExports\Diagnostic.xlsxStep 2 – Add Enumerated Labels to the Status Variable
The Data Export engine writes a numeric code to the status variable to indicate the current export state. Adding enumerated labels to that variable makes the status readable at a glance in mimics with “Label display” animation.
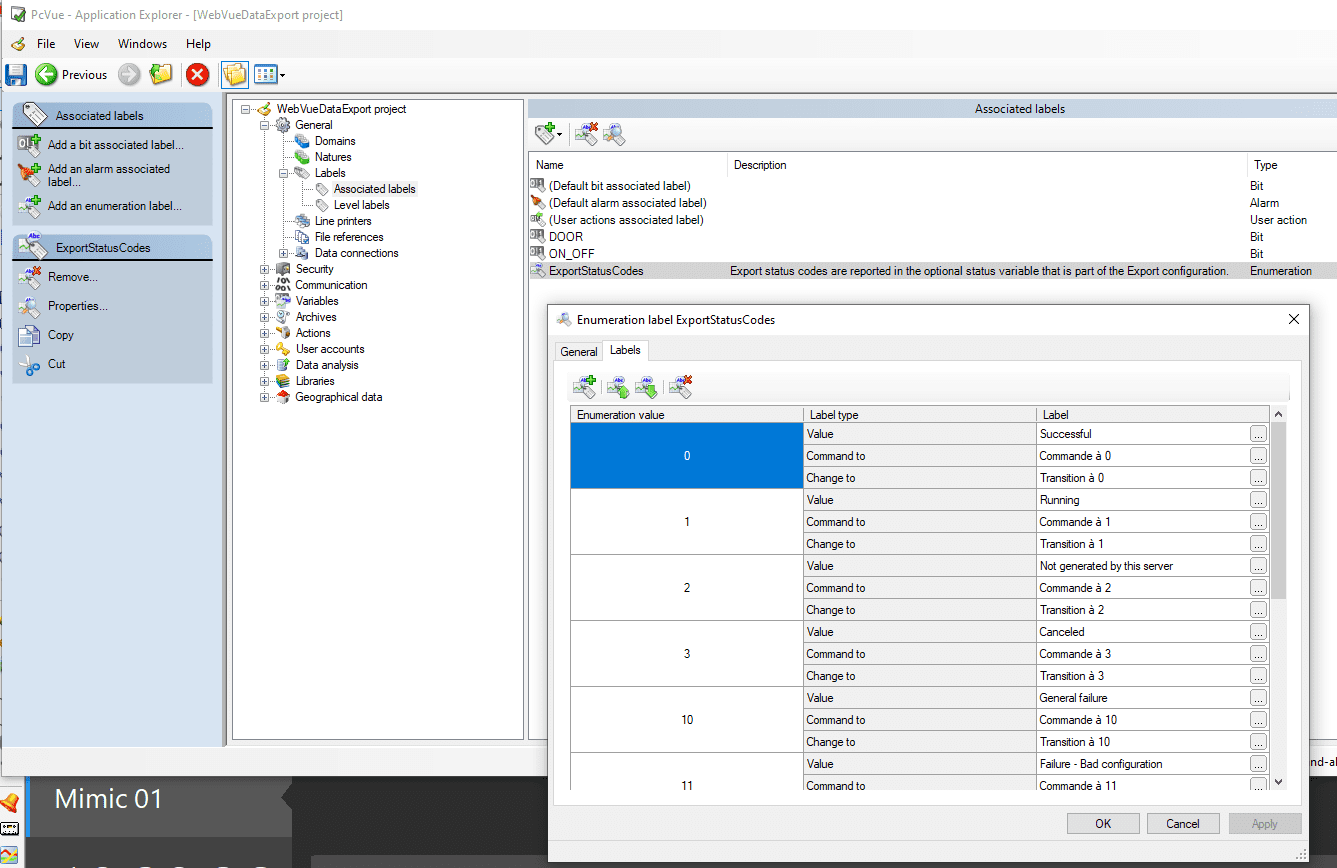
Note: The exact numeric values and their meanings are documented in the Data Export section of the PcVue Reference Guide.
Step 3 – Write the SCADA Basic Scripts
The two actions are implemented as subroutines in the program PROGLOADED.SCB (located in the P\ folder of the project). This program is loaded at PcVue startup.
' PROGRAM : PROGLOADED.scb
' Loaded at start-up from the program INIT.scb

SUB GenerateExport()
  Export("GENERATE", "DIAGNOSTIC");
END SUB

SUB OpenExportFromWebVue()
  Webvue("HYPERLINK", "/DataExports/Diagnostic.xlsx", 1);
END SUB
GenerateExport()
Calls the Export() instruction with the GENERATE mode to trigger the production of the export named DIAGNOSTIC. The engine updates the status variable throughout the generation process.
OpenExportFromWebVue()
Calls the Webvue() instruction with the HYPERLINK mode to instruct the WebVue client to navigate to the URL /DataExports/Diagnostic.xlsx. The third parameter 1 opens the file in a new browser tab.
Note: The
/DataExports/path is a virtual directory configured in IIS – see Step 5.
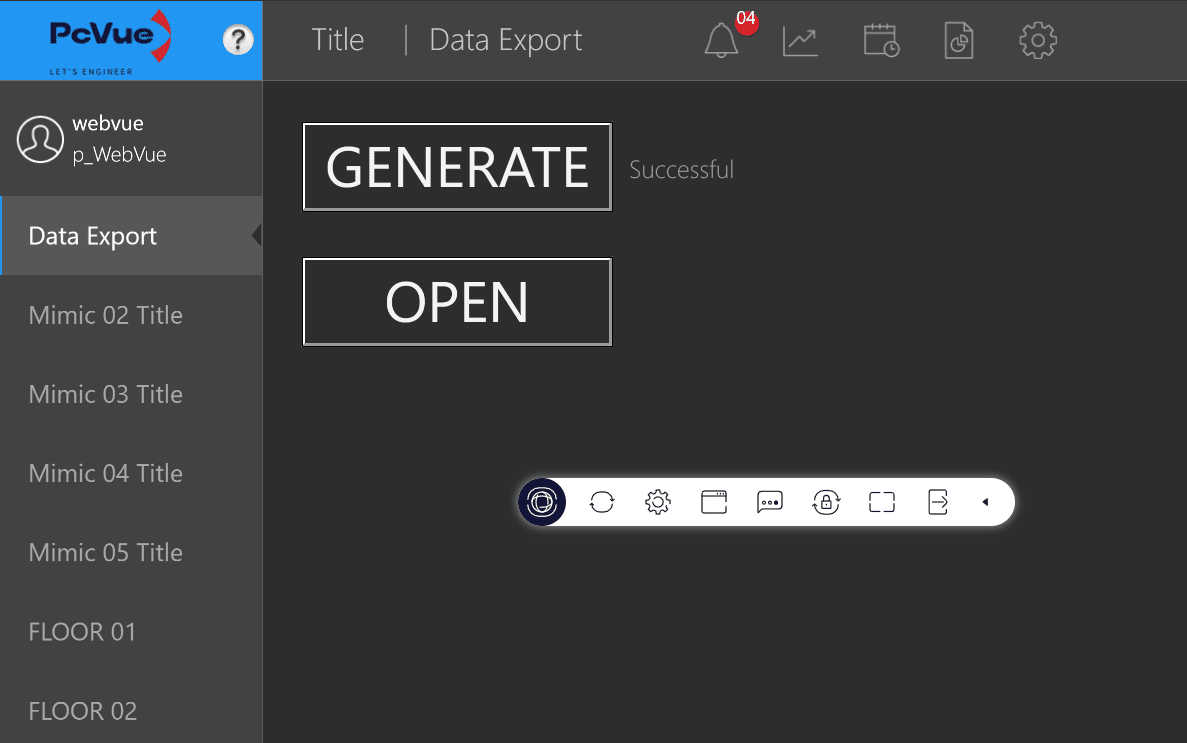
Step 4 – Configure the Mimic
Open mimic Mimic 01 in PcVue. The mimic contains three objects:
4a – Status display (text object)
A text object shows the current value of the status variable using the Display animation linked to @GENERAL.EXPORTS.DIAGNOSTIC.STATUS. Thanks to the enumerated labels configured in Step 2, the label (e.g., Done) is displayed instead of the raw numeric value.
4b – “GENERATE” button
A push-button calls GenerateExport() on click via a Run Program animation:
| Animation property | Value |
|---|---|
| Program | PROGLOADED.SCB |
| Subroutine | GenerateExport |
4c – “OPEN” button
A second push-button calls OpenExportFromWebVue() on click via a Run Program animation:
| Animation property | Value |
|---|---|
| Program | PROGLOADED.SCB |
| Subroutine | OpenExportFromWebVue |
This button also has a Visible animation based on @System.LocalHost.Session.Type set to show the button only in WebVue sessions (session type = 100), hiding it in PcVue desktop sessions. This is intentional: the Webvue("HYPERLINK", ...) instruction only works in a WebVue context.
Step 5 – Configure the IIS Virtual Directory
The Webvue("HYPERLINK", "/DataExports/Diagnostic.xlsx", 1) instruction uses the path /DataExports/ relative to the WebVue web application root in IIS. By default, IIS does not know where to find this folder, so a virtual directory must be added.
Procedure
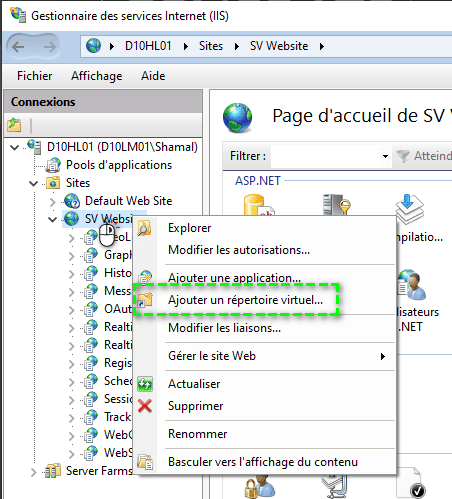
- Open IIS Manager (
inetmgr). - Expand the tree to locate the WebVue website.
- Right-click on it and select Add Virtual Directory…
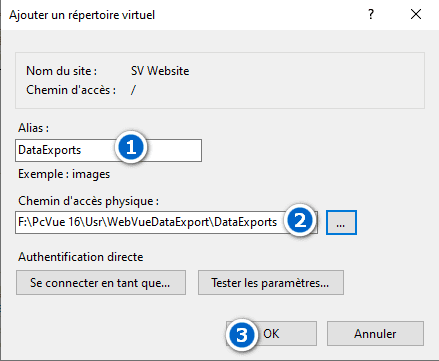
- Fill in the dialog: FieldValue Alias as
DataExports andPhysical path as Full path to theDataExports\folder of the PcVue project, e.g.C:\PcVue Projects\WebVueDataExport\DataExports - Click OK.
Important: The IIS application pool user (or the
IUSRaccount) must have Read permission on theDataExports\folder so that IIS can serve the file.
After this configuration, the URL https://<webclient_binding>/DataExports/Diagnostic.xlsx will resolve to the physical file generated by PcVue.
End-to-End Workflow
Once everything is configured:
- The WebVue operator connects to the WebVue interface and navigates to Mimic 01 – Data Export.
- The operator clicks GENERATE. The
GenerateExport()subroutine firesExport("GENERATE", "DIAGNOSTIC"). - The status label updates in real time: Idle → In progress → Done.
- When the status label shows Done, the operator clicks OPEN. The
OpenExportFromWebVue()subroutine firesWebvue("HYPERLINK", "/DataExports/Diagnostic.xlsx", 1). - The browser opens a new tab and downloads/displays
Diagnostic.xlsxfrom the IIS virtual directory.
Sample Project
The sample PcVue project used in this article is available here:
Overview
The script is structured around a single common export launcher (DoExport) that is called by six period-specific sub-routines. Each sub-routine calculates the appropriate start/end timestamps for its period and invokes the common launcher.
Two trend variables are sampled per export:
| Trend variable | Meaning |
|---|---|
@BUILDING.ACTIVE_ENERGY | Active energy (kWh) |
@BUILDING.REACTIVE_ENERGY | Reactive energy (kvarh) |
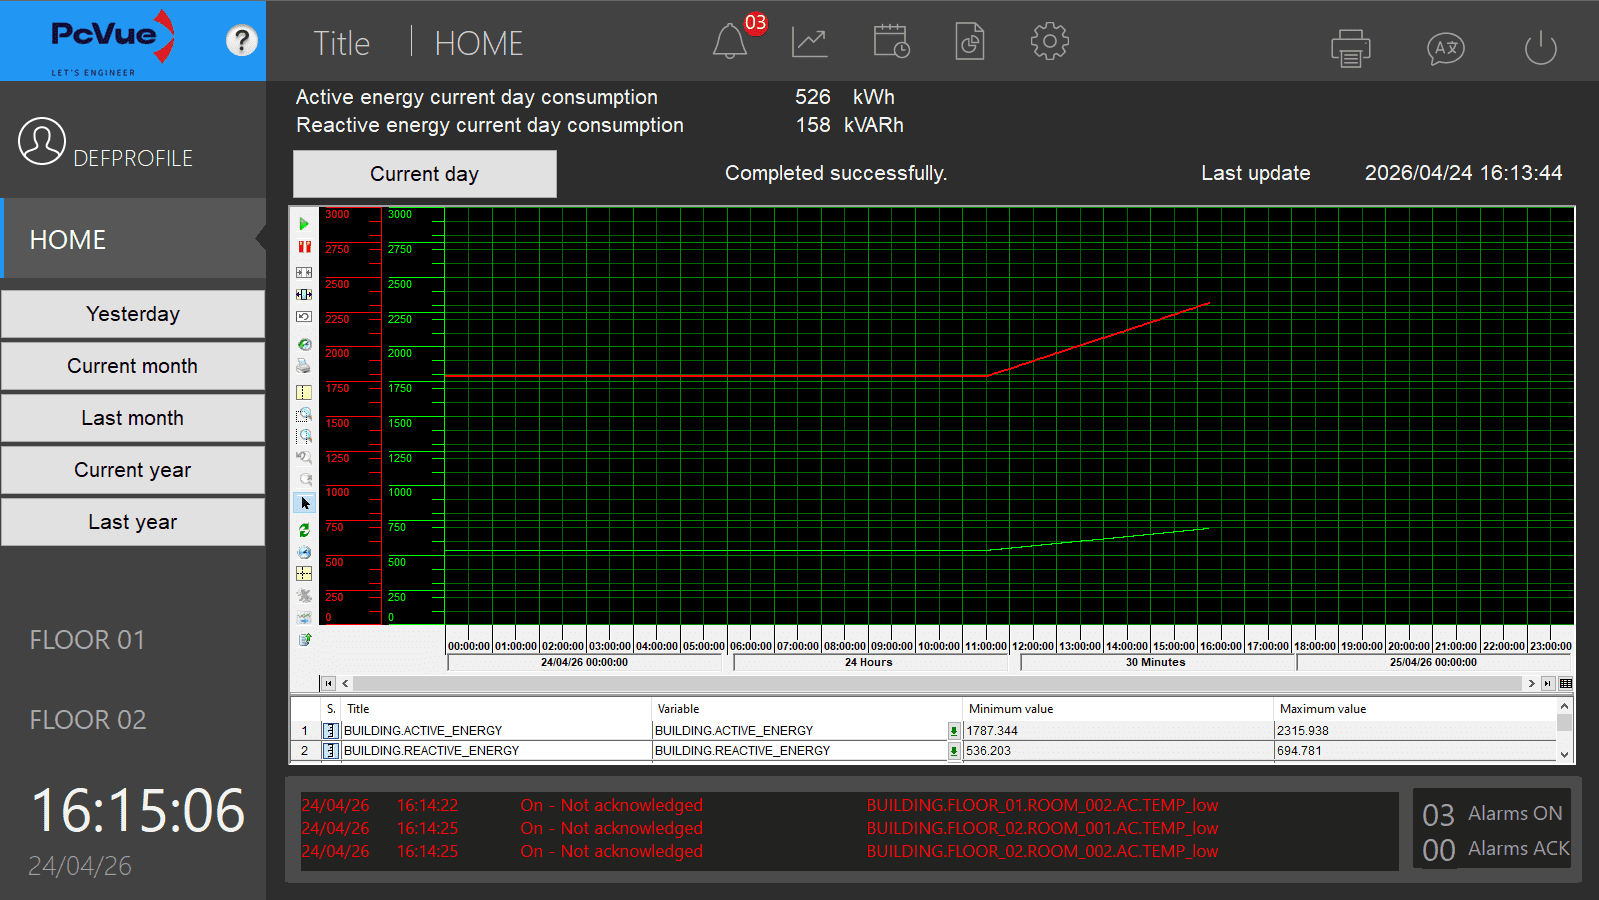
The COUNTER statistical flag (value 128) is used so that Export_Trend returns the difference between the last and first recorded values within the requested period, automatically handling meter rollover. Here below is the home mimic of the sample project with current day consumption display:
Scheduling
Counters are refreshed by two complementary mechanisms declared in Sub Main():
Cyclic triggers — current-period counters
Prime-spaced intervals are used to prevent simultaneous execution of the three cyclic jobs:
| Period | Interval (s) | Sub-routine | Target branch |
|---|---|---|---|
| Current day | 127 | Export_CurrentDayCounters | BUILDING.CONSUMPTION.CURRENTDAY |
| Current month | 131 | Export_CurrentMonthCounters | BUILDING.CONSUMPTION.CURRENTMONTH |
| Current year | 137 | Export_CurrentYearCounters | BUILDING.CONSUMPTION.CURRENTYEAR |
Crontab triggers — closed-period counters
These fire once per period boundary to capture the definitive counter value:
| Period | Schedule | Sub-routine | Target branch |
|---|---|---|---|
| Last day | Every day at 00:01 | Export_LastDayCounters | BUILDING.CONSUMPTION.LASTDAY |
| Last month | 1st of month at 00:02 | Export_LastMonthCounters | BUILDING.CONSUMPTION.LASTMONTH |
| Last year | 1st of month at 00:03 | Export_LastYearCounters | BUILDING.CONSUMPTION.LASTYEAR |
Note on offsets: The one- to three-minute offsets ensure that archiving of the last timestamp has completed before the export is triggered.
Period-Timestamp Calculation
All timestamps are expressed in milliseconds since 01/01/1980, as required by Export_Trend.
| Period | Start | End |
|---|---|---|
| Current day | DateTimeValue(DAY, MONTH, YEAR, 0, 0, 0) | DateTimeValue() (now) |
| Last day | Yesterday at 00:00:00 | Yesterday at 23:59:59 |
| Current month | DateTimeValue(1, MONTH, YEAR, 0, 0, 0) | DateTimeValue() (now) |
| Last month | 1st of previous month at 00:00:00 | Last day of previous month at 23:59:59 |
| Current year | DateTimeValue(1, 1, YEAR, 0, 0, 0) | DateTimeValue() (now) |
| Last year | DateTimeValue(1, 1, YEAR-1, 0, 0, 0) | DateTimeValue(31, 12, YEAR-1, 23, 59, 59) |
Previous-month bounds are computed by GetPreviousMonthBounds: subtracting 1 ms from the first instant of the current month always lands on the last instant of the previous month, giving the correct day, month, and year without any calendar arithmetic.
Export Flow
Period sub-routine
      │
      └─► DoExport(dStart, dEnd, sPeriod)
               │
               ├── g_sPeriod = sPeriod          ← store branth tag for the callback
               ├── Event("ADDPROG", "@EXPORT.STATUS", …, sPeriod, "Get_Counters")
               ├── Export_Trend("GETSTATISTIC", …, COUNTER)
               └── CheckExportReturn(iResult)
                         │
              ┌──────────┘ (async – on @EXPORT.STATUS change)
              │
              └─► Get_Counters()
                       │
                       ├── status 0 / 4 / 5 → read buffer, write registers, DISPOSE
                       ├── status 1          → still running, do nothing
                       └── other             → log error, CANCEL + DISPOSE
The completion event (@EXPORT.STATUS) is registered before Export_Trend is called to avoid a race condition where the export completes synchronously before the event listener is armed.
Buffer Reading — Get_Counters
Export_Trend("READBUFFER", …) returns a block structured as:
Line 0  — variable names  (skipped)
Line 1  — descriptions    (skipped)
Line 2  — data row:  <Counter> ; <active_energy> ; <reactive_energy>
Seq_Buffer with "\n" separator iterates lines; with ";" separator it iterates fields within a line. The Counter column (field 0) is discarded; fields 1 and 2 are read as DOUBLE and rounded before formatting.
Output Formatting — FormatWithSpaces
Raw integer values are converted to strings and a space character is inserted every three digits from the right (e.g., 1254300 → "1 254 300"). This is done with a single forward pass:
- Convert the number to a string with
TOC(). - For each character at position
i(1-based), insert a space when(len − i) MOD 3 == 2andi > 1.
Values of three digits or fewer are returned unchanged.
Error Handling — CheckExportReturn
If Export_Trend returns a non-zero value immediately (synchronous error), CheckExportReturn prints a human-readable description of every documented error code (−1 through −30) and calls CANCEL + DISPOSE to release the internal request object.
Debug Mode
Set Const DEBUG = 1 at the top of the script to enable Print trace output in the SCADABasic log. Set back to 0 in production.
Required Configuration
| Item | Requirement |
|---|---|
| Trend recording | @BUILDING.ACTIVE_ENERGY and @BUILDING.REACTIVE_ENERGY must be configured for trend recording in PcVue. |
| Data Export licence | The Data Export module must be licensed in the PcVue protection key. Without it, Export_Trend runs in demonstration mode only. |
| Output variables | ACTIVE_ENERGY_TXT and REACTIVE_ENERGY_TXT must exist as text variables in the application. |
| Status register | @EXPORT.STATUS must exist as a register in the application. |
| Unit | The UnitName parameter is set to PROP_UNIT01; adjust to match your project’s unit name. |
Attached Files
What is IEC104 and why use it?
IEC104 is the TCP/IP variant of the IEC 60870-5 family and is widely used in electric utilities and grid automation for real-time telecontrol. It’s designed for secure, structured transfer of time-tagged measurements, commands, and status information between control centers and field equipment.
For engineers, IEC104 offers:
Native TCP connectivity for WAN, fiber, and routed networks
Standardized ASDU/IOA addressing for predictable mapping
Strong support for time tagging, commands, and reporting
PcVue supports IEC104 natively, letting you connect, verify, and map data without dealing with low-level protocol complexity.
Setting Up Your IEC104 Device in PcVue
Step 1 – Gather Your Device Information
Before opening PcVue, collect a few essential parameters from your device. These are usually all you need for a successful connection:
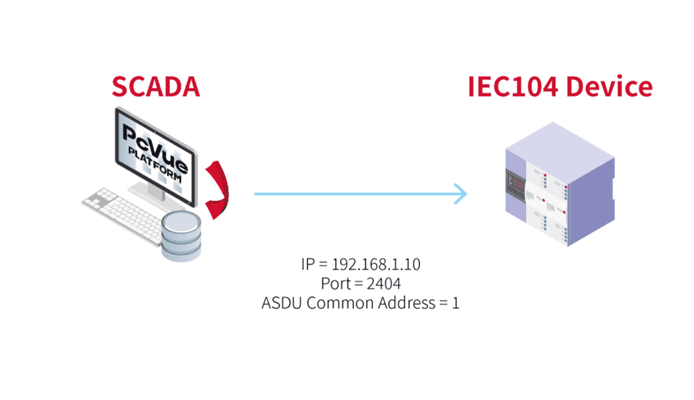
| Parameter | Example | Description |
| IP Address | 192.168.1.10 | The IP address of your IEC104 device |
| Port | 2404 | Default TCP port for IEC104 communication |
| ASDU (Common) Address | 1 | The ASDU/CA assigned to the outstation |
💡 Tip: These values are usually in the device’s communications menu or vendor manual.
Step 2 – Create an IEC104 Network
In PcVue, communication is organized using Network objects. Networks group IEC60870-5 devices and define the communication context, which is especially helpful when you have multiple stations or distributed architectures.
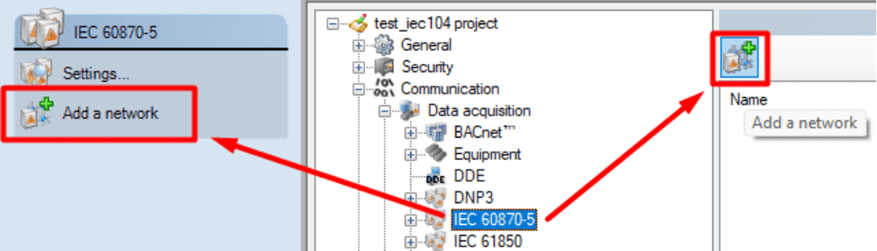
To add an IEC60870-5 Network:
- Open the Application Explorer.
- Expand Communication → Data acquisition → IEC 60870-5.
- Click the Add a Network button and give the new network a clear name (for example, “IEC104_Network”).
- Keep default settings unless you’re implementing multi-station setups.
The Network is your communication backbone — once created, add IEC104 Device objects underneath it. If you only run a single PcVue station, no extra configuration in the Network is normally required.
Step 3 – Configure the IEC104 Device
Once your Network is created, the next step is to add the actual IEC 104 device — this represents your field equipment.
- In the Application Explorer, navigate into the newly created IEC104 Network.
- Click the Add an IEC 104 device button.
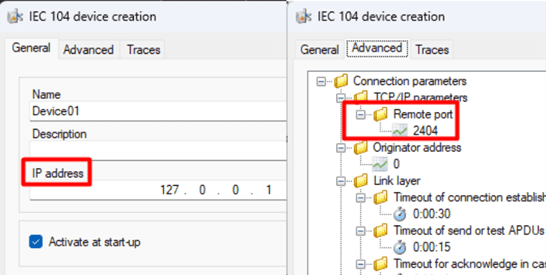
- In the General tab:
Enter the device’s IP Address. - In the Advanced tab:
Confirm the Port number (default: 2404).
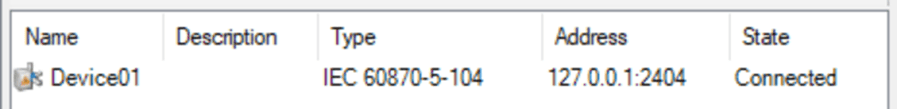
With this information PcVue will automatically attempt to connect to the device. If the parameters are correct, the device State should switch to Connected within seconds.
💡 Tip: At this stage, you don’t need to map any variables — seeing “Connected” confirms the TCP session.
Step 4 – Add a Sector (required to see data)
A connected device gives you network-level communication, but PcVue needs a Sector to interpret and browse IEC104 data. You can think of it as the layer that tells PcVue which ASDU (Common Address) to associate with that device’s application data.
To add a Sector:
- In the Application Explorer, navigate into the newly created IEC104 Device.
- Click Add a Sector.
- In the Sector dialog, enter the device’s Common Address of ASDU (required).
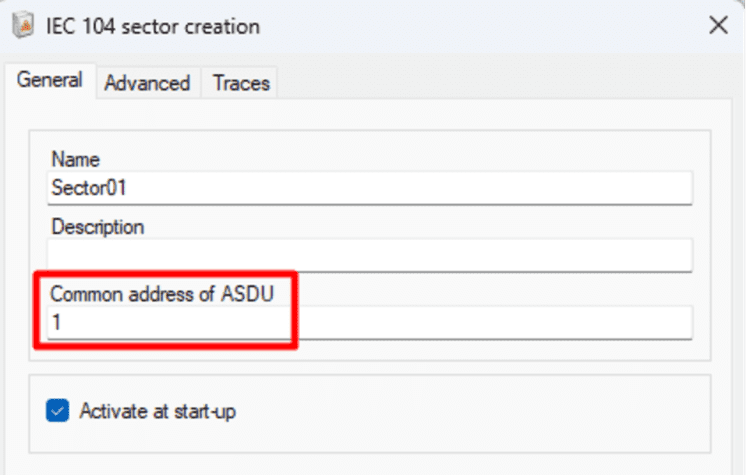
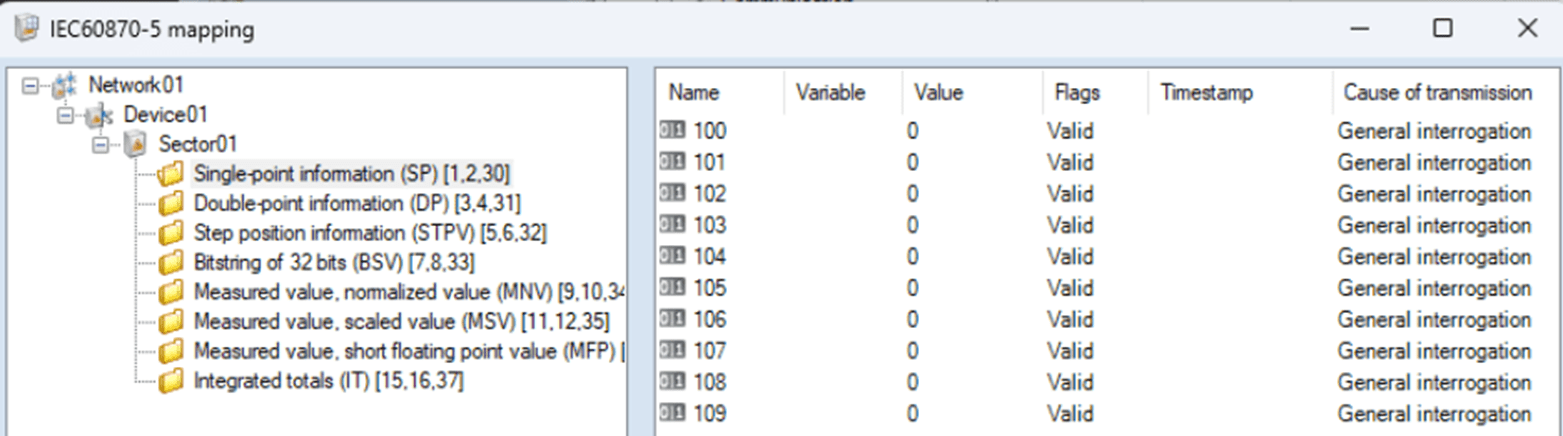
Once the Sector is present and the ASDU is correct, mapping and browsing will show meaningful IEC104 objects (IOAs) in the Mapping window.
Step 5 – Verify and Troubleshoot Communication
Once your IEC104 Device is configured, PcVue will automatically try to connect.
If the setup is correct, you’ll see the State column display “Connected.”
If it shows “Disconnected,” here are a few quick ways to check what’s going on:
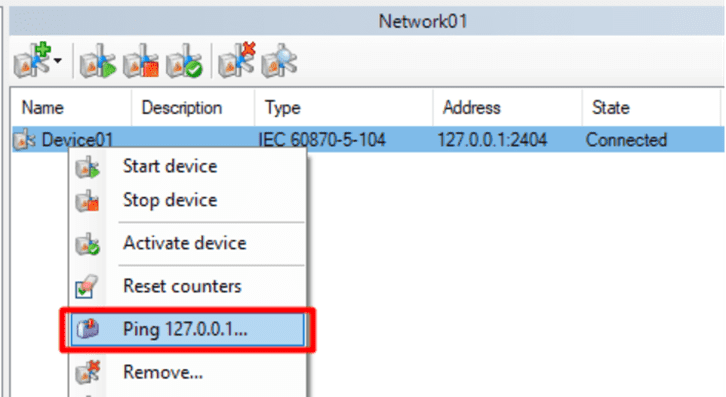
Ping the device:
Right-click the IEC104 Device in the Application Explorer.
Select “Ping XXX.XXX.XXX.XXX” to verify that the device is reachable
If the ping fails, check your network cabling, firewall, or IP configuration.
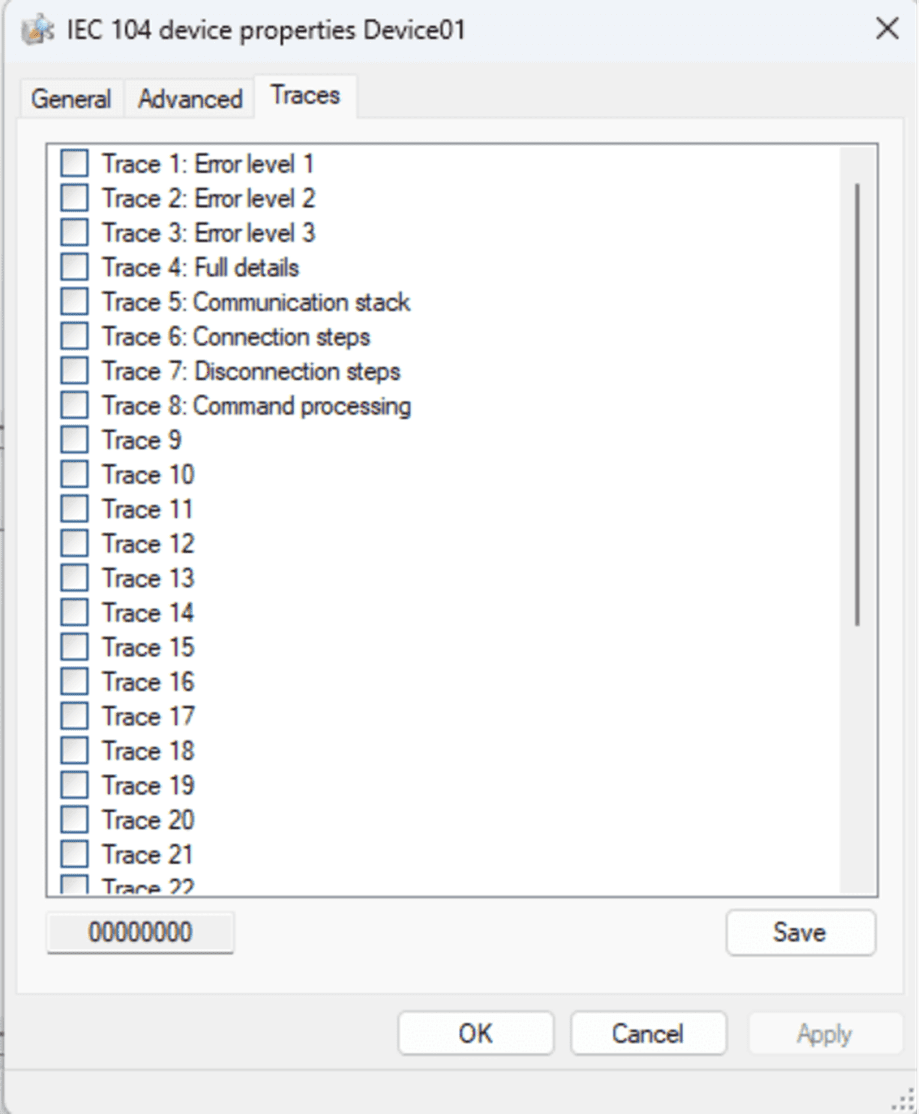
View the Traces tab:
Open the Traces tab in the Device configuration.
Enable traces to generate detailed communication logs in the Event Viewer.
This helps identify connection issues such as mismatched link addresses or unreachable ports.
Usually, if the parameters in the General and Advanced tabs are correct, you’ll get a Connected state within seconds.
No further setup or variable mapping is required to confirm that your IEC104 communication is working.
Step 6 – Explore Your Data with Mapping
Once your device shows Connected, you’ve successfully established communication — congratulations!
The next step is to start visualizing or using your field data inside PcVue.
PcVue provides an intuitive Mapping tool to make this process simple.
In the Application Explorer, select the IEC104 Network you created (or right-click on it), and choose Mapping.
This opens a browser window where you can explore the objects available in your IEC104 device — such as digital inputs, analog values, or counters — and link them directly to variables in your PcVue project.
You can:
Map to new variables automatically created from the device’s structure.
Link to existing variables already configured in your application.
Filter or browse by object type to find exactly what you need.
Once mapped, these variables can be displayed in mimic diagrams, logged, or used in alarms — just like any other PcVue variable.
💡 Tip: You don’t need to complete this step to confirm your connection. Mapping simply allows you to take the next step: transforming raw data into actionable SCADA information.
Why PcVue Makes IEC104 Integration Simple
PcVue reduces the friction of IEC104 commissioning by combining a clear UI model (Network → Device → Sector → Mapping) with sensible defaults and built-in diagnostics:
Native IEC104 driver — no middleware required.
Minimal mandatory fields — IP, Port (Device), and ASDU (Sector).
Quick diagnostics — Ping, State, and Traces help isolate issues fast.
Scalable workflow — from one device in a lab to multiple devices across substations.
“With PcVue, IEC104 setup becomes as simple as entering an IP address and an ASDU.”
Discover PcVue’s full portfolio of communication drivers and supported protocols.
Conclusion
IEC104 gives you a standardized path to integrate field equipment over TCP/IP. With PcVue’s Network/Device/Sector model, only a few values are required to establish a working link and start mapping data. Start with one device, confirm Connected, add a Sector, and map the points you need.
Understanding DNP3: The Reliable Language of Utilities
DNP3 (Distributed Network Protocol) is a robust and secure protocol used primarily in power, water, and critical infrastructure to exchange data between remote devices and SCADA systems. It’s designed for reliability, time-stamped events, and operation over unreliable networks, key features for distributed systems.
In simple terms, DNP3 allows your SCADA to talk to remote devices like RTUs, relays, and IEDs with high accuracy and resilience, even in tough conditions.
The only challenge? DNP3 setup can seem intimidating for newcomers. That’s where PcVue’s native DNP3 driver makes life easy, so you can focus on your process, not protocol syntax.
Setting Up Your DNP3 Device in PcVue
Step 1 – Gather Your Device Information
Before starting PcVue, note a few essential parameters from your device. These are usually all you need for a successful connection:
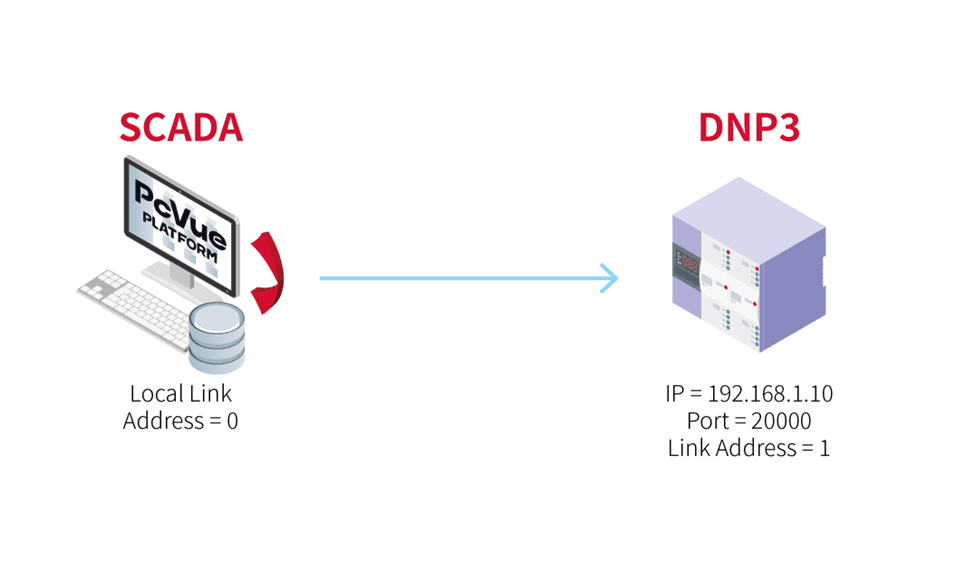
| Parameter | Example | Description |
| IP Address | 192.168.1.10 | The IP address of your DNP3 device |
| Port | 20000 | Default TCP port for DNP3 communication. |
| Link Address | 1 | The link-layer address of your DNP3 device. |
| Local Link Address | 0 | The link-layer address used by PcVue (the client/master). |
💡 Tip: These are typically available in the device’s communication menu or technical datasheet.
Step 2 – Create a DNP3 Network
In PcVue, communication is organized using Network objects. Networks group DNP3 devices and define the communication context, which is especially helpful when you have multiple stations or distributed architectures.
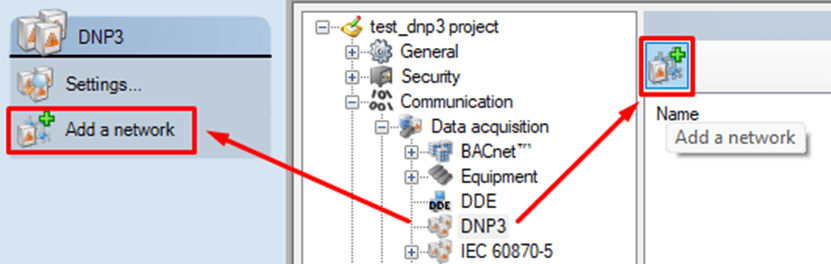
To add a DNP3 Network:
- Open the Application Explorer.
- Expand Communication → Data acquisition → DNP3.
- Click the Add a Network button and give the new network a clear name (for example, “DNP3_Network”).
- Keep default settings unless you’re implementing multistation setups.
The Network is your communication backbone — once created, add DNP3 Device objects underneath it. If you only run a single PcVue station, no extra configuration in the Network is normally required.
Step 3 – Configure the DNP3 Device
Once your Network is created, the next step is to add the actual DNP3 Device — this represents your field equipment.
- In the Application Explorer, navigate into the newly created DNP3 Network.
- Click the Add a Device button.
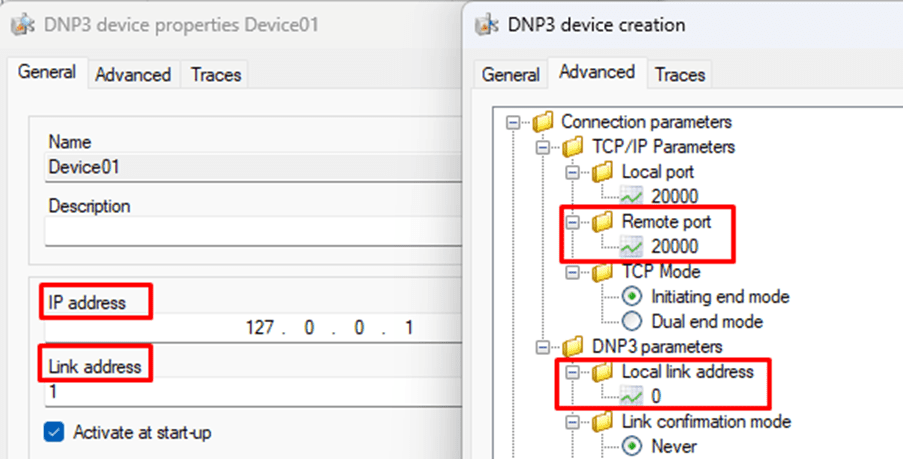
- In the General tab:
- Enter the device’s IP Address.
- Enter the Link Address (the address of the remote DNP3 device).
- In the Advanced tab:
- Confirm the Port number (default: 20000).
- Set the Local Link Address (the address used by PcVue as the DNP3 client/master).
Once you’ve entered these parameters, save your configuration.
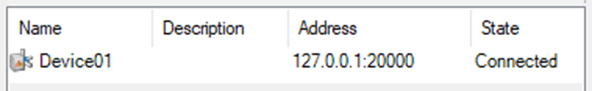
If everything is correct, PcVue will automatically attempt to connect. Within seconds, you should see the state change to “Connected” in the State column.
💡 Tip: At this stage, you don’t need to map any variables — seeing “Connected” confirms your communication setup is working.
Step 4 – Verify and Troubleshoot Communication
Once your DNP3 Device is configured, PcVue will automatically try to connect.
If the setup is correct, you’ll see the State column display “Connected.”
If it shows “Disconnected,” here are a few quick ways to check what’s going on:
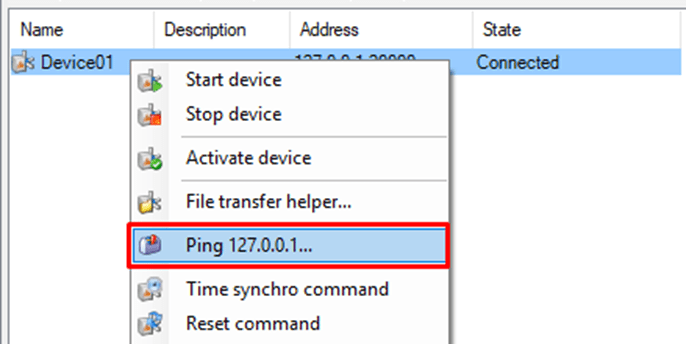
- Ping the device:
- Right-click the DNP3 Device in the Application Explorer.
- Select “Ping XXX.XXX.XXX.XXX” to verify that the device responds on the configured IP address.
If the ping fails, check your network cabling, firewall, or IP configuration.
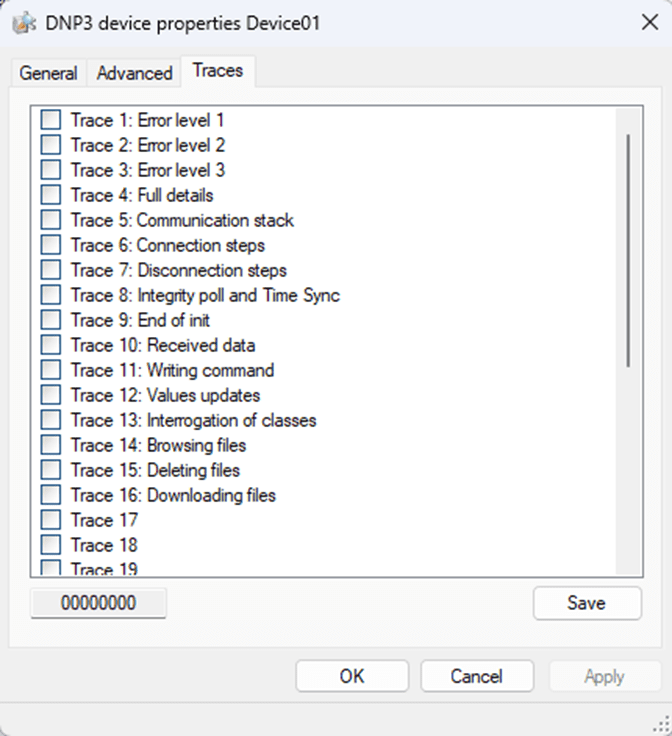
- View the Traces tab:
- Open the Traces tab in the Device configuration.
- Enable traces to generate detailed communication logs in the Event Viewer.
This helps identify connection issues such as mismatched link addresses or unreachable ports.
Usually, if the parameters in the General and Advanced tabs are correct, you’ll get a Connected state within seconds.
No further setup or variable mapping is required to confirm that your DNP3 communication is working.
Step 5 – Explore Your Data with Mapping
Once your device shows Connected, you’ve successfully established communication — congratulations!
The next step is to start visualizing or using your field data inside PcVue.
PcVue provides an intuitive Mapping tool to make this process simple.
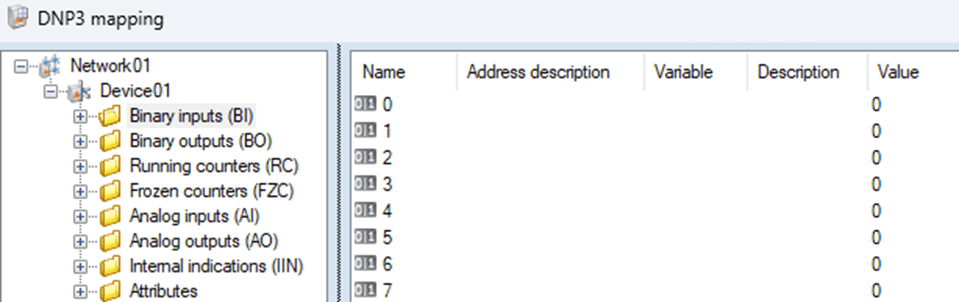
In the Application Explorer, select the DNP3 Network you created (or right-click on it), and choose Mapping.
This opens a browser window where you can explore the objects available in your DNP3 device — such as digital inputs, analog values, or counters — and link them directly to variables in your PcVue project.
You can:
- Map to new variables automatically created from the device’s structure.
- Link to existing variables already configured in your application.
- Filter or browse by object type to find exactly what you need.
Once mapped, these variables can be displayed in mimic diagrams, logged, or used in alarms — just like any other PcVue variable.
💡 Tip: You don’t need to complete this step to confirm your connection. Mapping simply allows you to take the next step: transforming raw data into actionable SCADA information.
Why PcVue Makes DNP3 Integration Simple
Many SCADA systems require long configuration cycles or external tools to bring a DNP3 device online. PcVue reduces that complexity by design. Here’s how:
- Native DNP3 over TCP: Fully integrated and ready to use — no add-ons or middleware needed.
- Smart Defaults: Standard parameters like port 20000 and retry logic are preconfigured for quick tests.
- Built-In Diagnostics: Real-time connection status helps you confirm communication instantly.
- Scalable Architecture: From a single test bench to full utility networks, PcVue keeps your configuration consistent and expandable.
“With PcVue, DNP3 configuration takes minutes, not hours. It’s plug, configure, and go.”
Learn more about PcVue’s communication drivers and protocol suite.
Conclusion
DNP3 is a powerful and reliable protocol — and with PcVue, it’s also simple.
In just a few minutes, you can go from zero to live data, integrating complex field devices into a modern SCADA system with minimal setup.
Start small, connect fast, and scale confidently — with PcVue.
Watch our step-by-step guide through the configuration process –> https://youtu.be/Uxg2695EKJY?si=WjSwFD3HBfp-3Cfv
The discovery of vulnerabilities in the PcVue client/server networking feature resulted in major fixes (see the security bulletin SB2025-4).
These fixes include the addition of security features to ensure the confidentiality and integrity of the messages exchanged between PcVue stations.
These security features are enabled by default only for new projects but not for migrated project (e.g. from version 16.2 to 16.3.4).
To apply them please follow the steps described below :
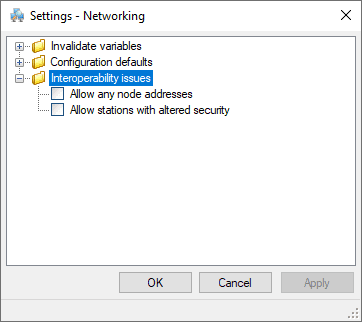
- Open the Application Explorer
- Go to the Networking feature
- Open the Settings dialog from the left panel
- In the Interoperability issues section uncheck the following options :
- Allow any node addresses
- Allow stations with altered security
- Save and deploy the modified project to all stations
If these settings are not the same at each station, they can’t communicate with each other. This situation will persist until the stations are configured in the same way.
During this transient stage, the following warnings are logged and displayed in the event viewer :
2025/09/01,10:37:27.760,3,D,,3388,,11,Networking message version of station SERVER1 = 163000
2025/09/01,10:37:27.760,3,W,,3712,,11, Networking, the version ‘163000’ of the remote station ‘SERVER1’ is not compatible due to security constraints
2025/09/01,10:37:27.760,3,W,,3072,,11,Client->server connection CLIENT10C -> SERVER10S is aborted
…
2025/09/01,10:37:46.228,3,I,,3070,,11,Server->client connection CLIENT10S -> SERVER10C is OK
2025/09/01,10:37:46.230,3,W,,3716,,11,Networking, connection CLIENT10S -> SERVER10C is not secure, the remote node ‘DATASERVER10’ must not alter the security or the local node must allow it
2025/09/01,10:37:46.230,3,W,,3142,,11,Server->client connection CLIENT10S -> SERVER10C is rejected
We strongly recommend applying the security features as soon as possible to avoid exposing the SCADA system to the discovered vulnerabilities.
The ‘Allow stations with altered security‘ option has been implemented to disable the security feature when a migration is to be carried out in several stages over a period of time.
The ‘Allow any node addresses‘ option has been implemented to disable a whitelist filter controlling which IP addresses are authorised to connect to the station.
This whitelist is defined by the Networking configuration.
Please contact your technical support if you have any question regarding these security features.
Introduction to Trace.log and Event viewer
- The Event viewer in PcVue is limited to displaying a few hundred lines of errors. You can call it by pressing F7 on the keyboard.
- The Trace.log file can grow up to 10MB, making it difficult to handle with standard text editors.
- Sorting through many minor errors to find important problems can be difficult.
Importance of Minimizing Errors
- Large Trace.log files can slow down system performance and make error analysis too complex.
- Reducing minor errors can help in identifying and resolving more serious issues efficiently.
- Unnecessary errors can create noise, making it harder to focus on critical problems.
Steps to Minimize Errors
- Regular Monitoring and Maintenance: Implement continuous monitoring of system variables and adjust archiving parameters accordingly.
- Resolve Minor Errors: Addressing minor errors can sometimes resolve more serious issues, improving overall system health.
- Limit HDS Traces: Configure tracing parameters to limit continuous insertions, especially for files. Disable non-essential Audit traces.
- Navigate to the HDS icon in the Windows bar.
- Open “General parameters…” in the “Debug” menu.
- Validate with only essential options ticked (e.g., Error, Warning).
- More information on HDS here.
Best Practices
- Regularly review and clean up the Event viewer and Trace.log files.
- Configure the scripts to only log significant changes or errors.
- Schedule regular maintenance tasks to prevent the accumulation of errors.
Meaning of error code
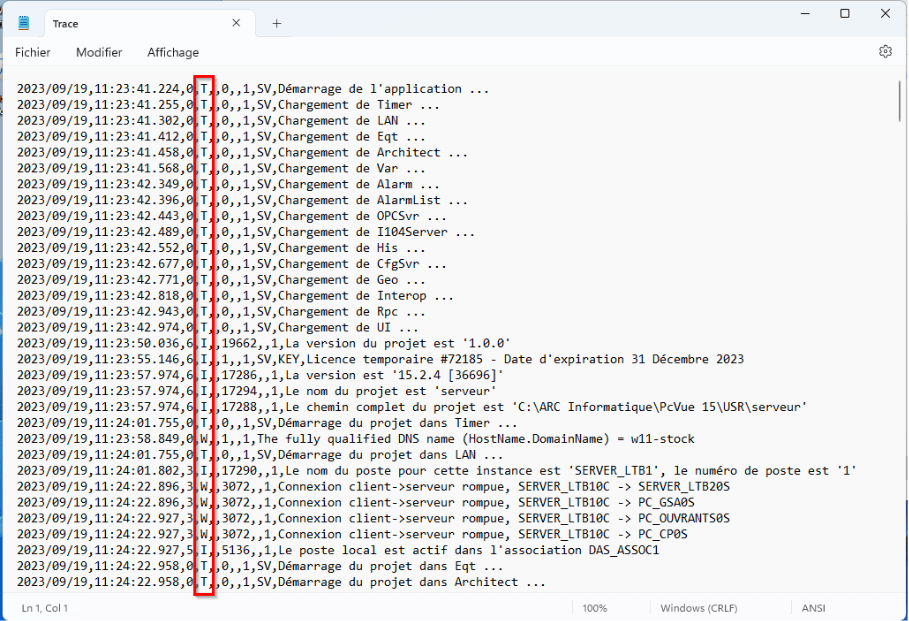
I Infomation
Generally useful information to log (service start/stop, project loading, user logon, license number, …). Info that are important in the lifecycle of the application/project, but that are usually not useful under normal circumstances.
E Error
Any error that is fatal to the project, but not to the application (communication loss with equipment, license expiration, …). These errors will force user (administrator, or direct user) intervention.
W Warning
Anything that can potentially cause application and/or project oddities, but for which they can automatically recover (such as switching from a primary to passive server, retrying an operation, incorrect setting, …).
D Debug
Information that is diagnostically helpful to people more than just developers (integrators, IT, sysadmins, etc.).
T Trace
Only for “tracing” the code and to track specific details in one part of a function. They should be activated on demand and per component, as they can be very verbose.
A Application
Error generated by the project. (Configuration error)
F Fatal
Any error that is forcing a shutdown of the application to prevent data loss (or further data loss), or due to application instability (null pointer, …).
How to fix errors

Search for a Warning or an Error you want to fix, W or E in the event viewer or Trace.log file.
Then do a research in our knowledge base of either the message (connection abort) or the code for this message (3072).
The advantage of searching for the message code is that it does not change depending on the display language of PcVue.
Prerequisites
- Images are from Windows Server 2019
- PcVue installed
- Administrative access to the server
Step-by-Step Configuration
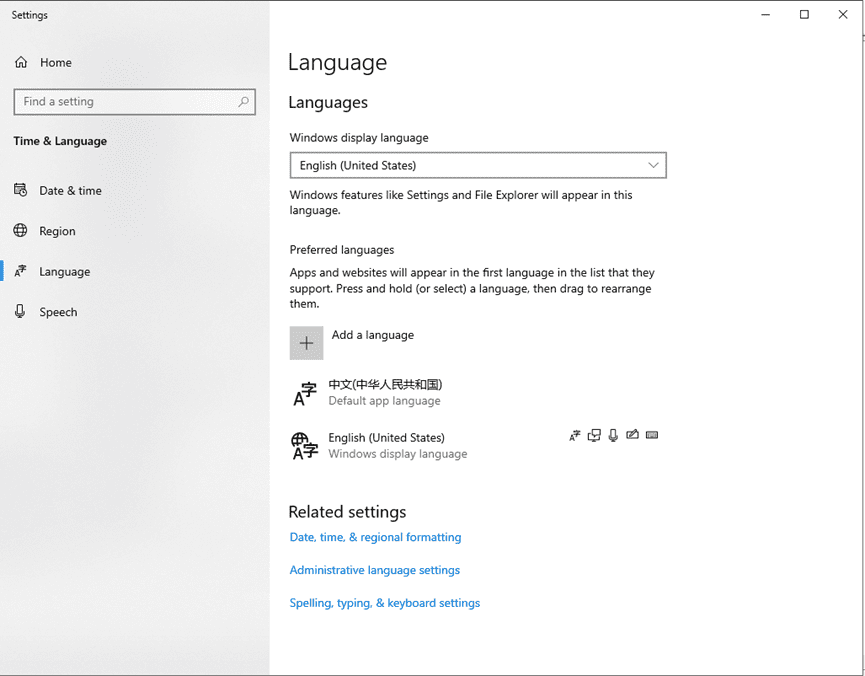
1. Add and Set the Default App Language
- Open Settings > Time & Language > Language.
- Under Preferred languages, click Add a language and select the desired No-Latin language (e.g., Chinese (Simplified, China)).
- Set the newly added language as the default app language by dragging it to the top of the list.
Example: Chinese set as the default app language in Windows Server 2019.
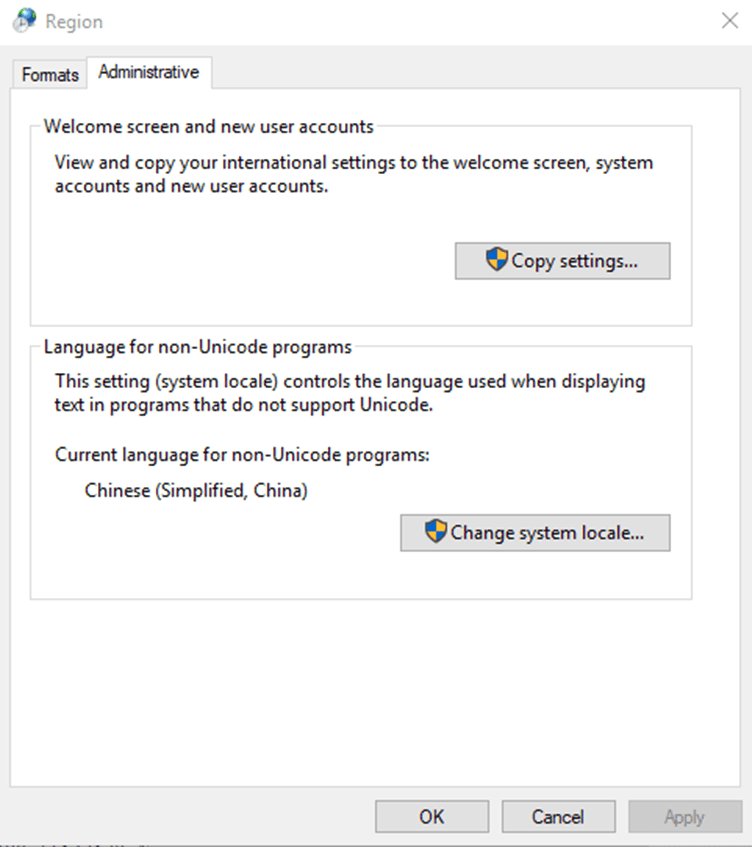
2. Change Region Settings for Non-Unicode Programs
- Open Settings > Time & Language > Region.
- Go to the Administrative tab.
- Under Language for non-Unicode programs, click Change system locale….
- Select the appropriate language (e.g., Chinese (Simplified, China)) and confirm with OK.
Example: System locale set to Chinese (Simplified, China).
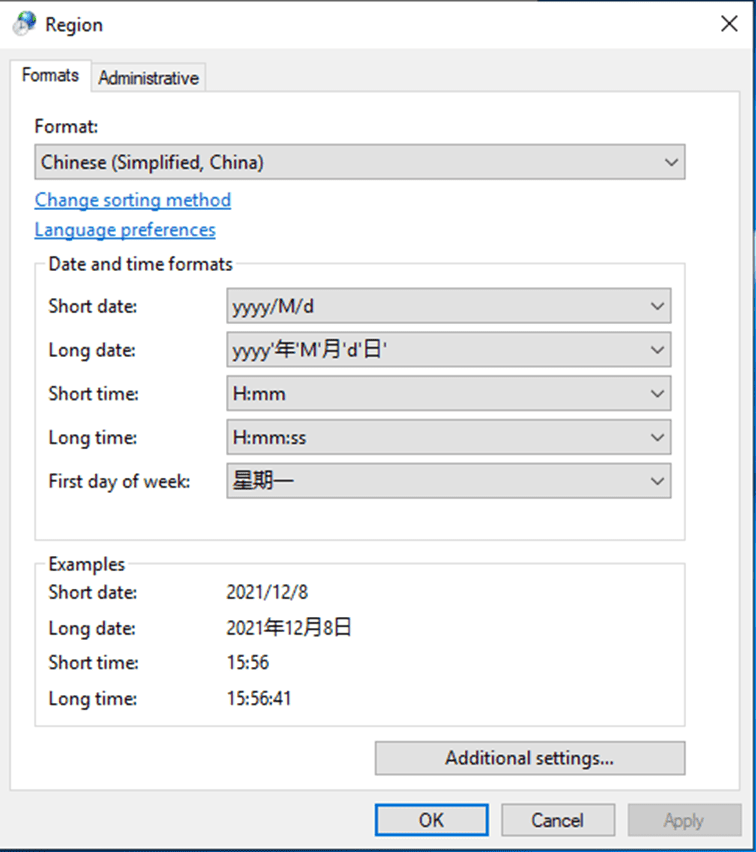
3. Update Region Format Settings
- In the Region settings, go to the Formats tab.
- Set the Format to match the No-Latin language (e.g., Chinese (Simplified, China)).
- Ensure date, time, and number formats are consistent with the selected language.
Example: Region format set to Chinese (Simplified, China).
Important Notes
- Restart Required: After applying these changes, restart the server for the settings to take full effect.
- PcVue Controls: If the region format is not updated, Non-Latin characters may not display correctly in PcVue controls (e.g., event viewer, combobox).
Context
On versions of PcVue prior to 16, there was no native browser (Web Browser Control). Instead, it was possible to use a browser via ActiveX.
However, when using this browser, error messages may appear when loading web pages, indicating compatibility issues. By default, ActiveX uses the Internet Explorer 7 web engine, which is obsolete and does not support modern website features.
For example, you might encounter the message: ‘Webvisu not supported due to missing browser feature HTML5-Canvas’.
Solution
IMPORTANT: This method contains steps that tell you how to modify the registry. However, serious problems might occur if you modify the registry incorrectly. Therefore, make sure that you follow these steps carefully. For added protection, back up the registry before you modify it. Then, you can restore the registry if a problem occurs. For more information about how to back up and restore the registry, click the following article number to view the article in the Microsoft Knowledge Base: 322756 – How to back up and restore the registry in Windows
To resolve this issue, you can force ActiveX to use the Internet Explorer 11 web engine, which is more recent. Here is how to proceed:
Note: Ensure you have administrator rights on your machine to make these changes.
1. Open the Registry Editor: Type regedit in the Windows search bar and press Enter
2. In the Registry Editor, navigate to the following path: HKEY_CURRENT_USER\SOFTWARE\Microsoft\Internet Explorer\MAIN\FeatureControl\FEATURE_BROWSER_EMULATION
3. Right-click in the right-hand pane, select New, then DWORD (32-bit) Value.

4. Name it sv32.exe, double-click on it, and assign it the value 11001 (select Decimal).
The value 11001 (in decimal) on these registry keys forces ActiveX to use the IE11 engine instead of the obsolete IE7 engine.

5. Now, navigate to this second key: HKEY_LOCAL_MACHINE\SOFTWARE\Microsoft\Internet Explorer\MAIN\FeatureControl\FEATURE_BROWSER_EMULATION
6. Reproduce exactly the same steps to create a DWORD sv32.exe with the value 11001.
You can activate the silent mode on the properties of the Microsoft® ActiveX control browser to avoid error messages :

Conclusion
Restart your PcVue project. By following these steps, you should be able to resolve the compatibility issues with the Microsoft® ActiveX browser.
Note
If you set the DWORD registry key to 0, it will select the latest Microsoft® browser available on the PC.
Context
When migrating a project from PcVue 15 to 16, you may encounter issues where commands or switches using the “Bit Send” animation no longer work as expected. This occurs specifically under the following configuration:
- Animation Type: Bit send
- Mode: Pulse checked
- Duration: 0 seconds

Analysis & Root Cause
The interpretation of a “0-second pulse” has been updated in PcVue 16 to improve logical consistency.
- In PcVue 15: A 0-second pulse was treated as a Direct Activation, functioning like a standard switch and maintaining the value.
- In PcVue 16: A 0-second pulse is now interpreted literally as an instantaneous pulse. As a result, the value may not be held long enough to trigger the expected state change in the connected device or variable.
Solution
Choose the appropriate solution based on the desired behavior for your equipment:
Case 1: Direct state change
If the control was intended to toggle a state (e.g., turn a valve ON/OFF) and maintain it, the “Pulse” setting is no longer suitable.
- Open the symbol or mimic containing the control.
- Open the properties of the “Bit Send“ animation.
- Uncheck the “Pulse” (Impulsionnel) option.
- Save the symbol.
This restores the behavior observed in V15, where the switch toggles the state.
Case 2: Momentary signal (True Pulse)
If the PLC or device actually requires a rising edge or a temporary signal:
- Open the properties of the “Bit Send” animation.
- Keep “Pulse” checked.
- Set the duration to a valid time (e.g.,
1second or more).
Note: The value will automatically return to its initial state (0) after the specified duration.
Fix planned in 12.0.32, 15.2.13 and 16.3.3
If the security fix described in security bulletin SB2025-4 is enabled, networking packets can be falsely detected as malformed, causing a server station to force a disconnection. This issue leads to a situation where a client station may not be able to stay connected to a server station in a stable way.
Recommendation:
The issue does not manifest itself if the recent hardened connection mechanism is disabled. To disable this mechanism, the security alteration setting named ‘Networking.Allow security altering configuration options’ must be checked and the property ‘Allow stations with altered security’ on Nodes must be set to Yes.
Fix planned in 16.3.3
Since 16.3.0, BACnet COV re-subscriptions are not handled correctly, leading to a situation where BACnet variables are no longer monitored nor refreshed. Because the issue is related to re-subscription, it becomes obvious only after some time, once a re-subscription is necessary (typically 1 hour).
Recommendation:
A workaround exists. The issue does not exist in the legacy COV implementation. While it is no longer the default, it can be re-activated by adding the following key in the Etc\experimental.ini file:
[BACnetStackCov]
Enabled=1