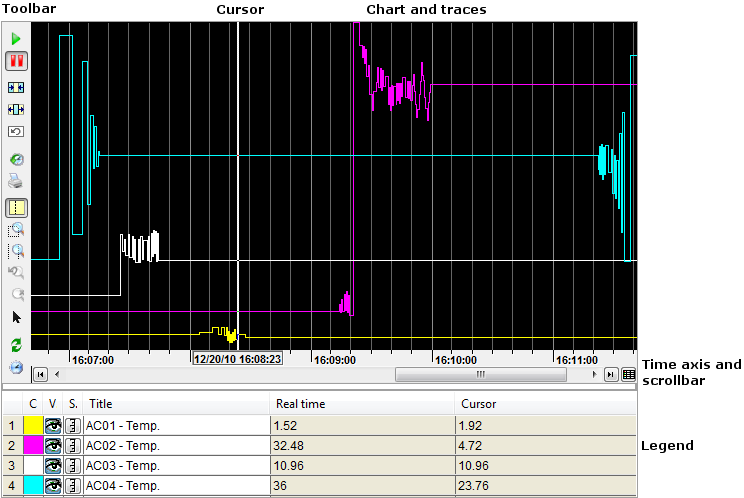
Trend Viewer Overview
The Trend Viewer is a control that produces
a display of up to 100 register or bit variables plotted against time. Any
number of Trend Viewers of any size can be embedded in a mimic, the only limitation
being the amount of physical space available. There is no limit to the
number of Trend Viewers that can be configured for a project. ![]() Show picture
Show picture
A Trend Viewer can be configured for either real-time or historical data.
- If a Trend Viewer is configured for real-time data, any register or bit from the variables tree can be added to the chart. When the mimic containing the Trend Viewer is opened in run mode, the current values of the variables are plotted on the right of the chart. The chart then scrolls left in real-time with new values being added on the right. Data on the chart is lost if the container mimic is closed.
- If a Trend Viewer is configured for historical data, only registers or bits from the variables tree that have been configured as being trend recorded, should be added to the chart. When the mimic containing the Trend Viewer is opened in run mode, historical values for the variables are plotted on the chart with the most recent on the right side. The chart can be scrolled through the entire history for the variables using the tool bar.
Chart and traces
The chart is the name given to the area where the data is plotted. Up to 100 variables can be plotted on the chart. Each plot is called a trace or curve. You select the variables and the style of each trace using the Curve and Advanced curve tabs of the configuration dialog. The style of a trace can be modified at run-time if the Legend is enabled and configured accordingly. A grid with x-axis (time) and y-axis (value) lines can be added to the chart to assist in the visualization of the traces. The grid is configured using the Grid tab of the configuration dialog. The y-axis lines are only displayed if the y-axis scale is enabled.
Time axis and scrollbar
The time axis and scrollbar appears at the bottom of the chart. The time axis is configurable from between 1 second to 3600 days using the Display tab of configuration dialog. The scrollbar and buttons, which are optional, are used to scroll through buffered data when a real-time Trend Viewer is in pause mode, or to move backwards and forwards through the recorded data for a historical Trend Viewer.
Toolbar
The toolbar provides access to the tools used for manipulating the Trend Viewer at run-time. The tools available to each Trend Viewer is configurable. The tool-bar can be positioned on the left, right, top or bottom of the viewer as required. The following tools are currently available: Play, Pause, Implode, Explode, Restore, Historic, Print, Cursor mode, Zoom area, Zoom time, Last zoom, Cancel zoom, Restore configuration, Change period, Select cross-hair cursor and Cancel historic request.
Cursor
The cursor can be positioned anywhere on the chart and used to display the value of the traces and the time and date stamp at that point.
Legend
The legend is an optional pane positioned below the main Trend Viewer. The legend contains one row for each trace and several columns for the display of information from the Trend Viewer at run-time. The columns that are available are selected using the Legend tab of the configuration dialog. Some of the information is read and write so, for example, you can change what variables are displayed and their maximum and minimum display range.
Summary of features
- Highly configurable look and feel.
- Trend Viewers can be embedded in any mimic
- Unlimited number of Trend Viewers in each project.
- Historic and real-time modes.
- Historic data can be replayed from either proprietary or HDS archive units.
- Up to 100 traces each representing a register or a bit.
- Optional display of thresholds for each trace.
- Y axis (range) independently configurable for each trace.
- X axis (time) configurable from 1 second to 3600 days.
- Toolbar to change run-time configuration.
- Zoom on both X and Y axes.
- Configurable Legend area displaying detail of each trace.
- Access from VBA for custom features.
- Options specifically for touch screens.
- Export data in Excel or CSV file formats.
