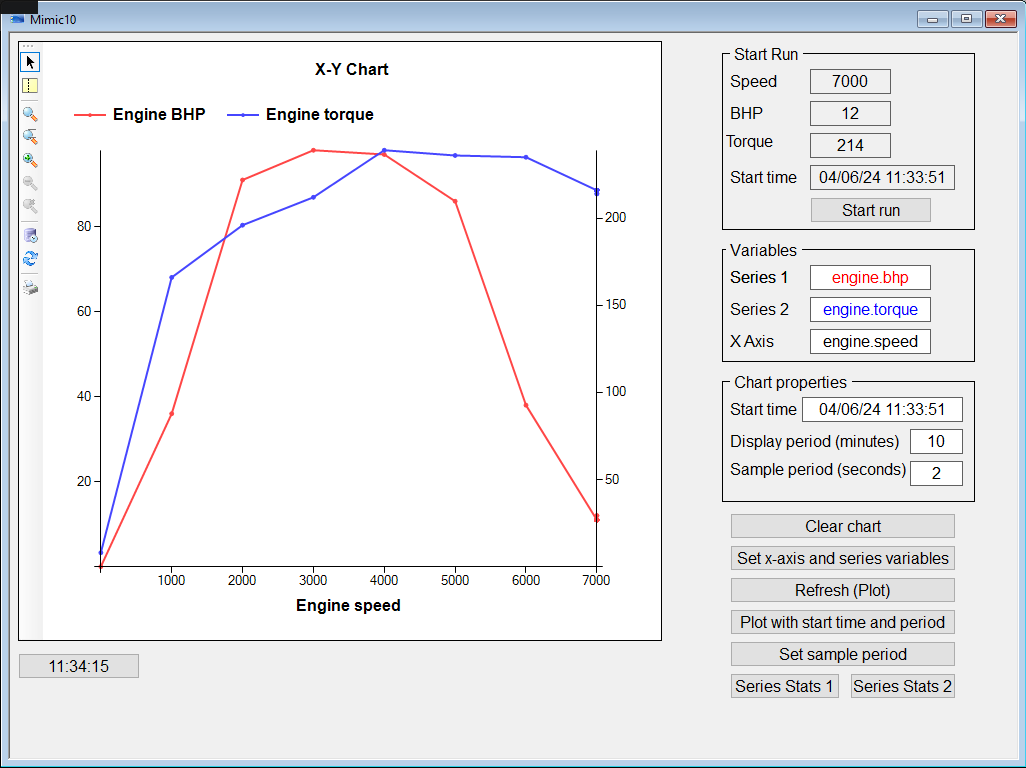
This program illustrates the use of the CHART instruction.
Example prerequisites
- The text variables @Chart_Xaxis, @Chart.Series1 and @Chart.Series2 are required. These variables must have the Command property set.
- The register variables @Chart.Start, @Chart.DisplayPeriod and @Chart.SamplePeriod are required. These variables must have the Command property set.
- The variables selected for plotting in the chart must be configured with historical data recording.
-
A mimic containing the following.
- Send-Text animations to set the variables @Chart_Xaxis, @Chart.Series1 and @Chart.Series2.
- Send-Register animations to set the variables @Chart.Start, @Chart.DisplayPeriod and @Chart.SamplePeriod. The animation to set @Chart.Start should be configured to display date and time format.
-
A Chart animation.
 Show picture
Copy
DIM sWindow AS STR, sBranch AS STR, sIdentity AS STR;

'-------- Intialise program variables
Sub MAIN ()
  sWindow = "MIMIC10"; ' Mimic name
  sBranch = ""; ' Mimic branch
  sIdentity = "Chart1"; ' Chart animation ID
End Sub

'-------- Refresh (plot) chart
SUB EXEC_REFRESH()
  DIM lReturn AS LONG;
  lReturn = CHART("REFRESH", sWindow, sBranch, sIdentity);
  PRINT("Return from REFRESH = ", lReturn);
END SUB

'-------- Set the variables for the x axis and series 1 and 2 using the value of a text variable.
SUB EXEC_SERIES_SETVAR ()
  DIM lReturn AS LONG;
  DIM iSeriesID AS INTEGER;
  DIM sVariableName AS STR, sLabel AS STR, sTitle AS STR;
  CONST AXE = 1;

  sVariableName = @CHART.Xaxis; 'X-axis variable name
  sTitle = VARIABLE("LONGLABEL", sVariableName);
  lReturn = CHART("SETSOURCEVAR", sWindow, sBranch, sIdentity, sVariableName);
  PRINT("SETSOURCEVAR return = ", lReturn);
  lReturn = CHART("AXE_SETTITLE", sWindow, sBranch, sIdentity, AXE, sTitle);

  iSeriesID = 1;
  sVariableName = @CHART.Series1;'Series 1 variable name
  sLabel = VARIABLE("LONGLABEL", sVariableName);
  lReturn = CHART("SERIES_SETVAR", sWindow, sBranch, sIdentity, iSeriesID, sVariableName, sLabel);
  PRINT("SERIES_SETVAR return = ", lReturn);

  iSeriesID = 2;
  sVariableName = @CHART.Series2; 'Series 2 variable name
  sLabel = VARIABLE("LONGLABEL", sVariableName);
  lReturn = CHART("SERIES_SETVAR", sWindow, sBranch, sIdentity, iSeriesID, sVariableName, sLabel);
  PRINT("SERIES_SETVAR return = ", lReturn);
END SUB

'-------- Clearing the chart completely requies several actions using a number of the available modes.
'-------- Just setting a series, or x-axis, variable to null does not work - it must be set to an existing, but unused, variable.
SUB EXEC_CLEAR ()
  DIM lReturn AS LONG;
  DIM iSeriesID AS INTEGER;
  DIM sVariableName AS STR, sLabel AS STR, sTitle AS STR;
  CONST AXE = 1;

  sVariableName = "CHART.Clear";
  sLabel = " ";
  sTitle = " ";

  '-------- Clear series variables
  iSeriesID = 1;
  lReturn = CHART("SERIES_SETVAR", sWindow, sBranch, sIdentity, iSeriesID, sVariableName, sLabel);
  iSeriesID = 2;
  lReturn = lReturn + CHART("SERIES_SETVAR", sWindow, sBranch, sIdentity, iSeriesID, sVariableName, sLabel);
  '-------- Clear X-axis
  lReturn = lReturn + CHART("SETSOURCEVAR", sWindow, sBranch, sIdentity, sVariableName);
  lReturn = lReturn + CHART("AXE_SETTITLE", sWindow, sBranch, sIdentity, AXE, sTitle);
  '-------- Clear actual plot values
  lReturn = lReturn + CHART("SERIES_CLEAR", sWindow, sBranch, sIdentity, 1);
  lReturn = lReturn + CHART("SERIES_CLEAR", sWindow, sBranch, sIdentity, 2);
  '-------- Check all clear actions have worked
  IF(lReturn == 6) THEN
    PRINT("Clear chart variables and series OK");
  ELSE
    PRINT("Clear chart variables and series failed");
  END IF
END SUB

'-------- Plot with a start time and a period
SUB EXEC_SETSTARTTIMEPERIOD ()
  DIM lReturn AS LONG;
  DIM dStartTime AS DOUBLE, dInterval As DOUBLE;
  CONST SECONDS = 1;
  CONST MINUTES = 2;
  CONST HOURS = 3;

  dStartTime = @CHART.Start;
  dInterval = @CHART.DisplayPeriod;

  lReturn = CHART("SETSTARTTIMEPERIOD", sWindow, sBranch, sIdentity, dStartTime, dInterval, MINUTES );
  PRINT("Return from SETSTARTTIMEPERIOD = ",lReturn);
END SUB

'-------- Set the chart sample period
SUB EXEC_SETSAMPLEPERIOD()
  DIM lReturn AS LONG;
  DIM dStartTime AS DOUBLE, dSampleInterval As DOUBLE;
  CONST SECONDS = 1;
  CONST MINUTES = 2;
  CONST HOURS = 3;

  dStartTime = @CHART.Start;
  dSampleInterval = @CHART.SamplePeriod;

  lReturn = CHART("SETSAMPLEPERIOD", sWindow, sBranch, sIdentity, dSampleInterval, SECONDS);
  PRINT("Return from SETSAMPLEPERIOD = ",lReturn);
END SUB

'-------- Get series statistics. The series ID is passed as an argument.
SUB EXEC_SERIES_STATS ()
  DIM dReturn AS DOUBLE;
  DIM lSeriesID AS LONG;
  CONST XMINIMUM = 1;
  CONST XMAXIMUM = 2;
  CONST YMINIMUM = 3;
  CONST YMAXIMUM = 4;
  CONST AVERAGE = 5;
  CONST MEDIAN = 6;

'-------- Get series ID
  lSeriesID = LVAL(GETARG("ARG1"));
  PRINT("Series is ",lSeriesID);

'-------- Get statistics
  dReturn = CHART("SERIES_STATS", sWindow, sBranch, sIdentity, lSeriesID, XMINIMUM);
  PRINT("SERIES_STATS XMINIMUM = ",dReturn);
  dReturn = CHART("SERIES_STATS", sWindow, sBranch, sIdentity, lSeriesID, XMAXIMUM);
  PRINT("SERIES_STATS XMAXIMUM = ",dReturn);
  dReturn = CHART("SERIES_STATS", sWindow, sBranch, sIdentity, lSeriesID, YMINIMUM);
  PRINT("SERIES_STATS YMINIMUM = ",dReturn);
  dReturn = CHART("SERIES_STATS", sWindow, sBranch, sIdentity, lSeriesID, YMAXIMUM);
  PRINT("SERIES_STATS YMAXIMUM = ",dReturn);
  dReturn = CHART("SERIES_STATS", sWindow, sBranch, sIdentity, lSeriesID, AVERAGE);
  PRINT("SERIES_STATS AVERAGE = ",dReturn);
  dReturn = CHART("SERIES_STATS", sWindow, sBranch, sIdentity, lSeriesID, MEDIAN);
  PRINT("SERIES_STATS MEDIAN = ",dReturn);
END SUB