This program illustrates the use of the PIE instruction.
Example prerequisites
-
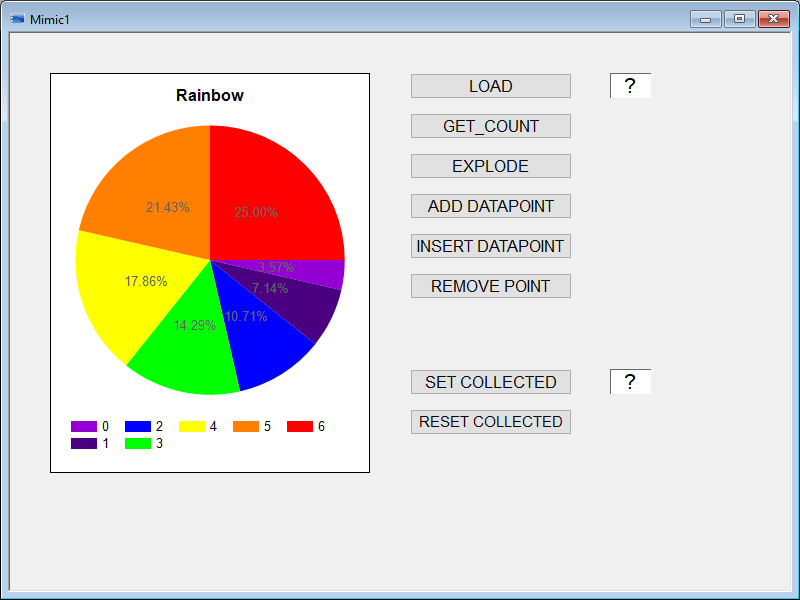
A mimic containing a Pie Chart must be open.
 Show picture
 -
A register variable called @SB_EXAMPLE.INDEX is required. This variable must have the Command property set.
-
A register variable called @SB_EXAMPLE.PERCENT is required. This variable must have the Command property set.
-
The text file that is used as the source for the Pie chart values must be located in the project's TP folder. The following is an example of a text file which contains the configuration for seven segments.
CopyChartPie1.dat
ASCII32
FONTS,BEGIN
FONTS,END
COLORS,BEGIN
COLORS,END
CIEXT,BEGIN,0,"","","0","","1.000000","1",""
CI,END
CIEXT,BEGIN,0,"","","1","","2.000000","1",""
CI,END
CIEXT,BEGIN,0,"","","2","","3.000000","1",""
CI,END
CIEXT,BEGIN,0,"","","3","","4.000000","1",""
CI,END
CIEXT,BEGIN,0,"","","4","","5.000000","1",""
CI,END
CIEXT,BEGIN,0,"","","5","","6.000000","1",""
CI,END
CIEXT,BEGIN,0,"","","6","","7.000000","1",""
CI,END
Copy
DIM sWindow As STR, sBranch As STR, sIdentity As STR, sFilePath As STR;
DIM iIndex As INTEGER, lReturn As LONG;
Const USEPERCENT = 1;

'-------- The Main SUB must be run first to initialize variables
SUB Main ()
  sWindow = "Mimic1";
  sBranch = "";
  sIdentity = "ChartPie1";
  sFilePath = "ChartPie1.dat";
END SUB

'-------- Explode slice using the variable SB_EXAMPLES.INDEX as the index
SUB Exec_Explode()
  iIndex = TOI(@SB_EXAMPLES.INDEX);
  lReturn = PIE("EXPLODED_SLICE", sWindow, "", sIdentity, iIndex);
  IF (lReturn == 1) Then
    PRINT("Explode slice ",sFilePath, " successful");
  ELSE
    PRINT("Explode slice failed");
  END IF
END SUB

'-------- Load the contents of a pie chart from a file. Note chart must be configured with the Source set to File.
SUB Exec_Load()
  lReturn = PIE("LOAD", sWindow, "", sIdentity, sFilePath);
  IF (lReturn == 1) Then
    PRINT("Chart load from file ",sFilePath, " successful");
  ELSE
    PRINT("Chart load failed");
  END IF
END SUB

'-------- Insert a datapoint using the variable SB_EXAMPLES.INDEX as the index.
SUB Exec_InsertPoint()
  iIndex = TOI(@SB_EXAMPLES.INDEX);
  lReturn = PIE("INSERT_DATAPOINT", sWindow, "", sIdentity, iIndex, 1, "", "Inserted datapoint");
  IF (lReturn == 1) Then
    PRINT("Chart insert datapoint ",iIndex, " successful");
  ELSE
    PRINT("Chart insert datapoint failed");
  END IF
END SUB

'-------- Add a datapoint to the end of the chart
SUB Exec_AddPoint()
  lReturn = PIE("ADD_DATAPOINT", sWindow, "", sIdentity, 1, "", "Added datapoint");
  IF (lReturn == 1) Then
    PRINT("Chart add datapoint successful");
  ELSE
    PRINT("Chart add datapoint failed");
  END IF
END SUB

'-------- Remove a point using the variable SB_EXAMPLES.INDEX as the index.
SUB Exec_RemovePoint()
  iIndex = TOI(@SB_EXAMPLES.INDEX);
  lReturn = PIE("REMOVE_POINT", sWindow, "", sIdentity, iIndex);
  IF (lReturn == 1) Then
    PRINT("Chart remove datapoint ",iIndex, " successful");
  ELSE
    PRINT("Chart remove datapoint failed");
  END IF
END SUB

'-------- Count the number of segments
SUB Exec_Count ()
  lReturn = PIE("GET_COUNT", sWindow, "", sIdentity);
  @SB_EXAMPLES.INDEX = TOS(lReturn);
END SUB

'------- Collect, label and color segments
SUB Exec_SetCollected()
  DIM iThresholdValue As INTEGER;
  iThresholdvalue = TOI(@SB_EXAMPLES.Percent);
  PIE("COLLECTED_THRESH", sWindow, sBranch, sIdentity, iThresholdValue, USEPERCENT);
  PIE("COLLECTED_LABEL", sWindow, sBranch, sIdentity, "Collected", "Collected");
  lReturn = PIE("COLLECTED_COLOR", sWindow, "", sIdentity, 127, 127, 127);
  IF (lReturn == 1) Then
    PRINT("Chart collection at ",ithresholdValue, "% successful");
  ELSE
    PRINT("Chart collection failed");
  END IF
END SUB

'-------- Reset collected segments
SUB Exec_Reset_Collected ()
  lReturn = PIE("RESET_COLLECTED", sWindow, sBranch, sIdentity);
  IF (lReturn == 1) Then
    PRINT("Chart reset collected successful");
  ELSE
    PRINT("Chart reset collected failed");
  END IF
END SUB