Creating a Trend Viewer and Configuring the Main Features
The method to create a Trend Viewer is the same as any other native drawing element.
- Open the mimic in which the Trend Viewer will be inserted and select Design mode.
- Select the Trend Viewer tool from either the animation toolbar or the menu.
- A Trend Viewer will be created and its properties dialog automatically opened ready for the configuration process.
Once you have configured the Trend Viewer and closed its properties box it can be moved, sized and copied the same as any other drawing element.
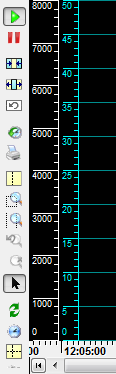
The main display features are configured using the Display tab. ![]() Show picture
Show picture

Selecting the start mode
The start mode is selected using the Real time and Historic buttons. If you want to prevent the User from changing modes, you will have to remove the corresponding tools from the toolbar.
Configuring the axes
The main property to configure for the horizontal (time) axis is the period. The period can be from 1 second to 3600 days. Be careful when choosing the period to use a value commensurate with the rate at which the data is changing. For example, if the data is changing every second, and your Trend Viewer is 1200 points wide, there is little to be gained by having a time period of more than 1200 seconds (20 minutes).
The other properties that affect the axes are as follows.
- Display time scale - Display a time axis scale at the bottom of the chart area. The default is on.
- Display grid lines - Turns the vertical grid lines on or off. The actual appearance of the grid lines is configured using the Grid tab. The default is on.
- Display time information - Display additional time information under the chart. The time at either end of the horizontal axis, the horizontal axis period and the grid division periods are displayed. The default is off.
- Display small curve scale - Display a smaller (narrower) version of the optional Y axis scale. The width occupied by the scale can be Auto or manually entered. If auto is used the width of the scale is automatically adjusted to accommodate the numeric scale.
 Show picture
Configuring a specific start day and time
Normally the start time of the trend (left side) is the current day and time minus the Period. However, using the Start date property you can force the start time of the Trend Viewer to a particular day and time relative to the current day. If you use a Start date, the Period is not used in calculating the start.
- Every day - The current day. For example, if the current date and time was Tuesday 5th February 2013 09:15 the start would be 05/02/2013 (plus the configured hours and minutes).
- Yesterday - Yesterday. For example, if the current date and time was Tuesday 5th February 2013 09:15 the start would be 04/02/2013 (plus the configured hours and minutes).
- Monday to Sunday - The first previous day corresponding to that selected. For example, if the current date and time was Tuesday 5th February 2013 09:15, and Thursday was selected, the start would be 31/01/2013 (plus the configured hours and minutes).
- First day of the month - The first day of the current month. For example, if the current date and time was Tuesday 5th February 2013 09:15 the start would be 01/02/2013 (plus the configured hours and minutes).
You would be most likely to use a specific start day for a historical Trend Viewer, although the option is also available for real-time.
Configuring the display buffer
The display buffer is used, for a real-time trend, to temporarily record values for the traces giving the User a limited ability to scroll back in time. The size of the scroll bar slider changes to reflect the amount of data stored in the buffer. For example, if the buffer contains 10 minutes of data and the chart is 2 minutes, the slider will be approximately one-fifth the length of the scroll bar. When the mimic containing the Trend Viewer is closed, the buffer is emptied unless the mimic is cached.
The following properties are used to configure the display buffer.
- Time capacity - The maximum period for which the display buffer will retain values for the traces.
- Maximum point buffer capacity - The maximum number of values that may be recorded in the display buffer. Normally this will be left at the default value of 10,000. However, if the application has any special requirements (for example, reducing the amount of memory required) this property may be changed. The maximum value is 36,000. Values are discarded when either the time capacity is reached or the display buffer is full.
Other properties from the Display tab
- Toolbar - Configure the display and position of the toolbar. The toolbar can be positioned at the top, bottom, left or right. The tools that are available to the User can only be selected when in run mode. See the topic Configuring a viewer's toolbar.
- Scrollbar - Configure the horizontal axis scrollbar. Display of the scroll bar can be disabled and its height changed. By default, a scrollbar of 17 points is displayed.
- Background - The color of the chart area on which the traces are plotted.
- Refresh period – A background refresh period, in seconds and tenths of seconds, at which the chart area is refreshed. The default of 0.5 seconds is adequate for most applications.
- Legend - Enable the Legend area and select the font in which any text is displayed. See the topic Configuring the legend area for information on how to configure the legend and what can be displayed.
You can specify more properties to control the graphical element visibility. From the Aspect tab, behind the down arrow at the bottom of the Properties dialog box:
-
Specify zoom visibility bounds so that the graphic control is only visible for predefined zoom levels.
-
Specify layers so that the graphic control is only visible if one of the selected layers is displayed.
These are even more useful when combined with user permissions and decluttering templates.