Trend view
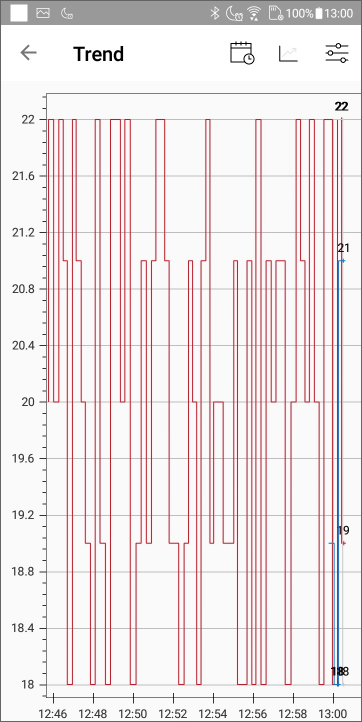
The Trend view displays a historic trend for one or more register variables. ![]() Show picture
Show picture
- In TouchVue, it can be opened from the Variable Details or Dashboard views.
- In SnapVue, it can be opened from the Variable Details view or a tile on the Home view.
If the Trend view is opened from a Variable Details view, then only that variable is plotted.
If the trend view is opened from the Dashboard view, then all variables that have been selected (in the Browsing view) are plotted.
Screen features
- If the variable is being recorded for archiving, the historical values are retrieved and displayed with a solid trace.
- If the variable is not recorded, the Trend view plots the values in real time with a dotted trace.
- By default, the Y-Axis auto scales according to the minimum and maximum value of the variable within the displayed period.
- The pinch open and pinch close gestures can be used to change the X-axis.
Menu actions

|
Change the time period. You can choose from a number of preset periods, which run back from the current time, or custom period where the period is defined by entering a start and end time. |

|
Change the trend Y-axis:
|

|
If displaying multiple traces (Dashboard view), allows display of individual traces to be disabled and enabled. |